About Tableau Pulse
With Tableau Pulse, users receive personalized data insights about metrics that they follow. These insights are sent directly to users in Slack and email digests, giving them access to the data they need in the tools they already use. If users want to learn more about their data, they can visit a metric's insights exploration page on Tableau Cloud. On that page, users can engage in guided data analysis to understand what is driving changes to their data.
Tableau Pulse is available for Tableau Cloud. To get a site ready for Tableau Pulse, a site administrator must first turn on the setting and make sure that there's appropriate data to work with. Then, users can create metric definitions, which specify the core metadata for metrics. Users create metrics based on these definitions by adjusting filter and time options to scope the data in ways that are useful for different groups of followers.
The articles here help you get started with Tableau Pulse, whether you're a Tableau administrator setting up your site, a Creator defining the metadata that metrics are based on, a Viewer exploring existing metrics, or a developer embedding metrics.
| Article | Audience | About |
|---|---|---|
| Set Up Your Site for Tableau Pulse | Site Administrators | Settings, permissions, and requirements for Tableau Pulse |
| Create Metrics with Tableau Pulse | Creators, Site Administrator Explorers, and Explorers (can publish) | Definitions and metrics and how to create them |
| Explore Metrics with Tableau Pulse | Creators, Explorers, and Viewers | The types of analysis you can do with existing metrics |
| Set Manual Goals and Thresholds with Tableau Pulse | Creators, Explorers, and Viewers | Goals and thresholds that let you track metric performance |
| Ask Questions and Discover Insights in Tableau Pulse(Link opens in a new window) | Creators, Explorers, and Viewers | Options for finding insights with Ask Q&A (single metric exploration) or with Enhanced Q&A (grouped metric exploration powered by AI in Tableau) |
| The Insights Platform and Insight Types in Tableau Pulse | Creators, Explorers, and Viewers | The insight types available in Tableau Pulse and general information about how the Insights platform works |
| Get Alerts About Tableau Pulse Insights | Creators, Explorers, and Viewers | New unfavorable trend alerts for the metrics that you follow |
| Work with Tableau Pulse Metrics and Dashboards | Creators, Site Administrator Explorers, and Explorers (can publish) | The Pulse dashboard object and recommended metrics based on dashboard data |
| Tableau Pulse REST API Methods(Link opens in a new window) | Developers | The API methods to create metrics, get metric details, generate insights, and more |
| Embed Tableau Pulse(Link opens in a new window) | Developers | The Tableau Embedding API web component for embedding metrics in a web page |
| Set Up the Pulse for Salesforce App | Salesforce customers | The Pulse app that Salesforce customers can purchase |
| Configure a Tableau Pulse Lightning Web Component | Salesforce customers | The Tableau Pulse Lightning web component for Salesforce Lightning pages |
| Interact with Data on Tableau Mobile(Link opens in a new window) | Creators, Explorers, and Viewers | Tableau Pulse on Tableau Mobile |
Added May 22, 2025
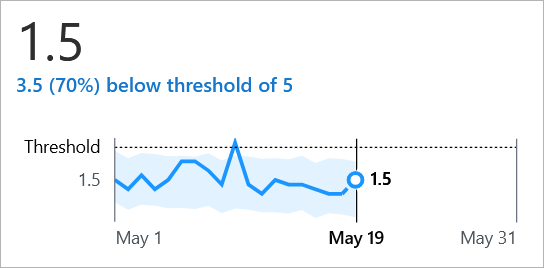
Set thresholds for metrics
Measure how a metric is performing relative to a threshold value by setting a data source or manual threshold. Data source thresholds are dynamic values that you set on a metric definition. Manual thresholds are a single static value that you set on an individual metric. Anyone who views a metric sees the threshold value. For more information, see Configure data source goals and thresholds and Set Manual Goals and Thresholds with Tableau Pulse.
Added May 7, 2025
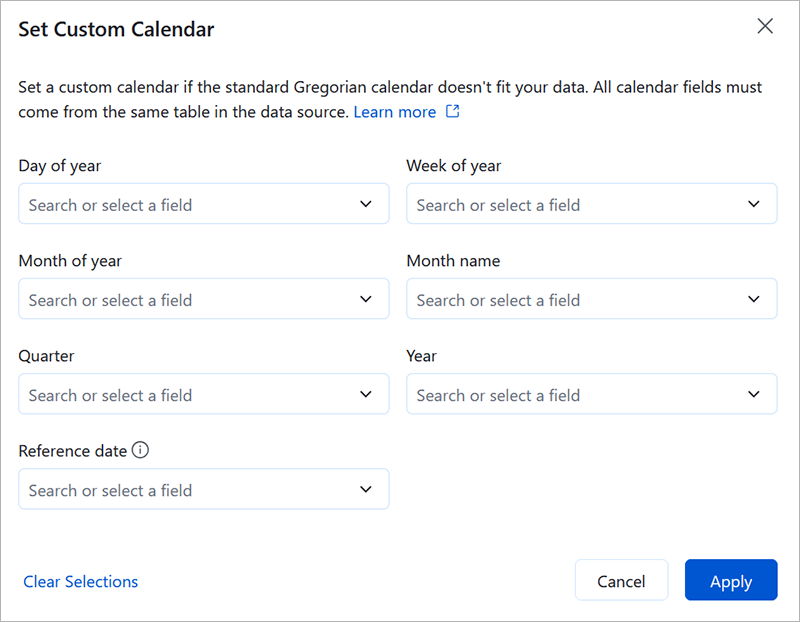
Set a custom calendar
If the standard Gregorian calendar doesn't fit your organization's data, set a custom calendar. You now have the flexibility to configure calendars such as a 4-5-4 retail calendar. Tableau Pulse aggregates metric data for different time ranges and comparison periods based on the custom calendar. For more information, see Set a custom calendar.
Ask questions based on dimension members in Enhanced Q&A (Discover)
Let your users follow their curiosity freely—exploring different regions, segments, or time periods—all through natural language in Enhanced Q&A (Discover). Discover can now handle questions that filter metrics based on dimension values (region, product, segment) or compare dimension members (West versus East) to uncover meaningful patterns.
For example, you could ask "Show sales for California" or "Compare APAC vs. EMEA" to automatically expand your exploration to the full set of compatible metrics. For more information, see Ask Questions and Discover Insights in Tableau Pulse.
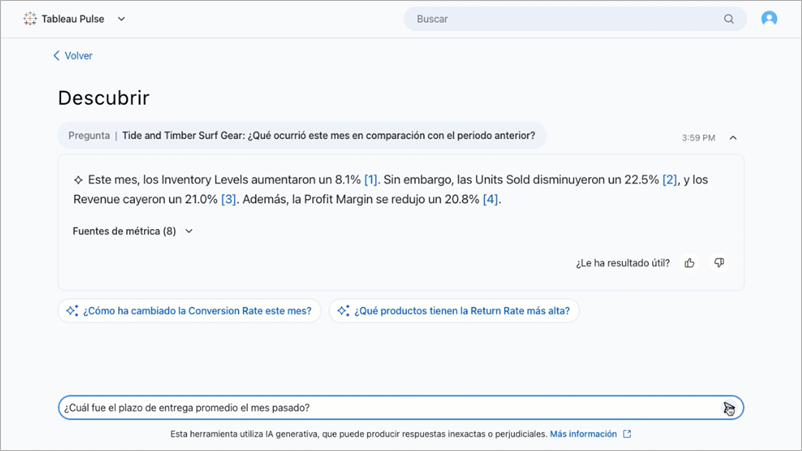
Ask questions and get responses in your preferred language with Enhanced Q&A (Discover)
Enhanced Q&A (Discover) now supports multilingual questions and responses, aligned with Tableau Cloud supported languages. Suggested questions, follow-up questions, and insight briefs adapt to the site’s language setting. Discover detects your input language as you ask questions and it returns LLM responses in that language—even if it differs from the site or data language. Metric names and filters always remain in their original, authored language for clarity and consistency. For more information, see Multilingual support for questions and responses in Discover.
Added April 24, 2025
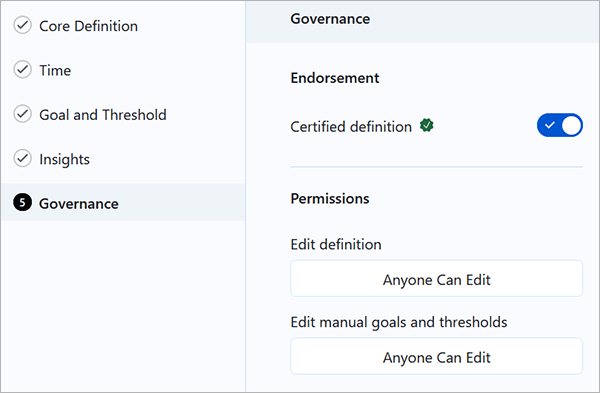
Certify metric definitions
Tell others that a metric definition is trusted and recommended by certifying it. A certified badge appears on metrics that are based on certified definitions. That badge helps users feel confident relying on those metrics to make business decisions.
You certify a metric definition on the new governance step that is part of editing or creating definitions. The existing permission settings for metric definitions have also moved to the governance step. For more information, see Configure governance.
Added April 10, 2025
Customize the metrics in your insights summary
When you follow a metric, notable changes about that metric can appear in the insights summary at the top of your Tableau Pulse home page and in your Slack and email digests. You can now further customize these summaries by muting metrics. When you mute a metric, insights about that specific metric are removed from your summary without unfollowing the metric. For more information, see Customize your home page and digests.
Added March 27, 2025
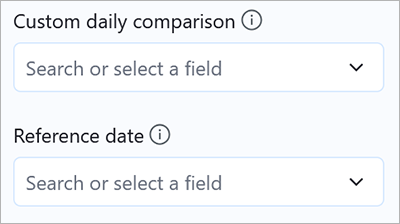
Set a custom comparison date for metrics
For metrics filtered to Today or Yesterday, a custom comparison overrides the comparison to the prior day or the same day from a year ago. This comparison option allows you to compare data for events that don’t fall on the same date each year. For more information, see Set a custom daily comparison.
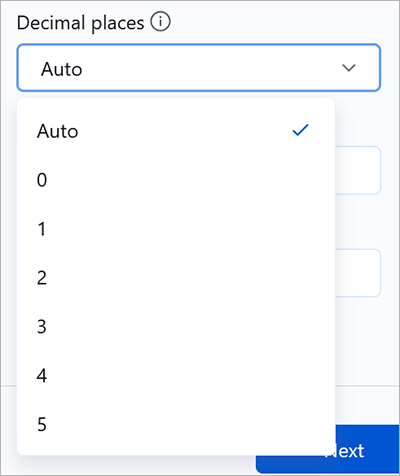
Choose the number of decimal places for metric values
If your data needs to be formatted with a consistent number of decimal places, you can choose the precise number, from 0 to 5. By default, Tableau Pulse automatically determines the number of decimal places to show, with larger values showing fewer decimal places. For more information, see Define metric options.
Added March 13, 2025
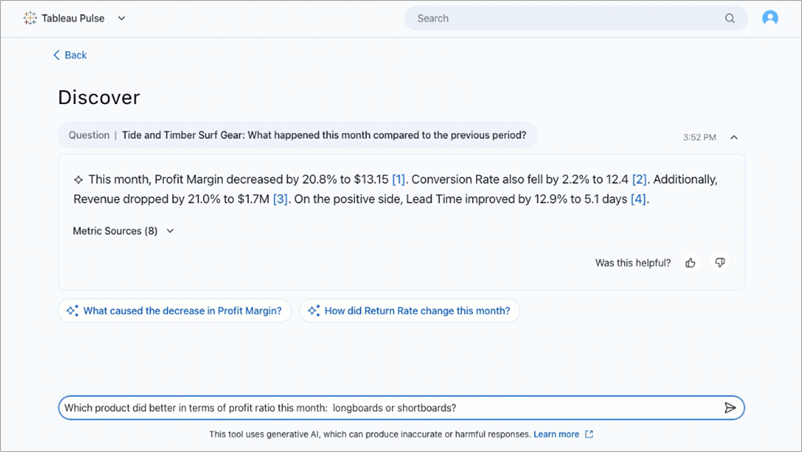
Discover more insights with enhanced Q&A (Tableau+)
Enhanced Q&A (Discover) makes it easier to explore insights across groups of business-critical metrics, and then dig deeper on the Discover page. When metrics in Tableau Pulse are grouped by data source, definition, or time range, Discover uses statistical algorithms to examine grouped metrics and surface insights that are relevant, interesting, and worth investigating.
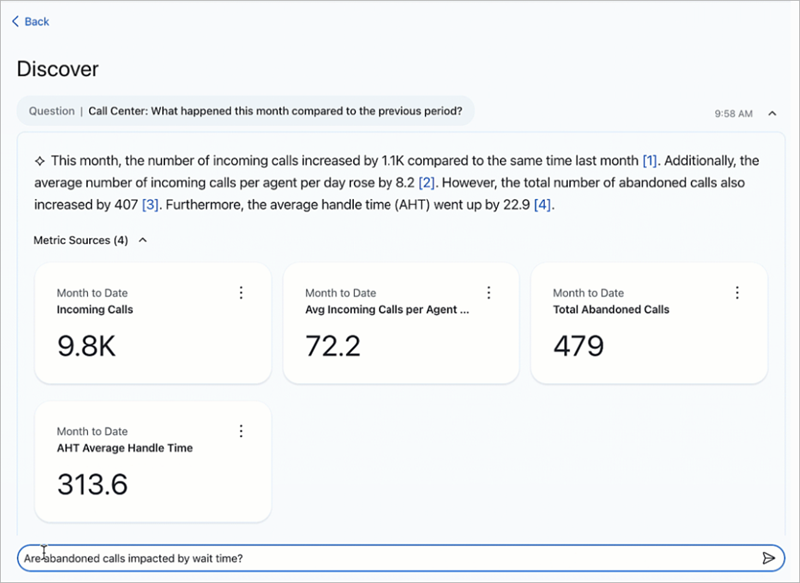
The enhanced Q&A experience provides intuitive key insights, relevant visualizations, source references, and suggested follow-up questions to help you dig deeper. Because it is powered by AI in Tableau, you can ask questions in your own words to get relevant, natural language answers about your data.
Enhanced Q&A (Discover) is available as a Tableau+ premium feature in Tableau Pulse on both web and mobile. Enhanced Q&A (Discover) must be turned on in Tableau Cloud site settings, and requires a connection to a Salesforce org that has Einstein generative AI set up for the selected Salesforce org. For more information, Ask Questions and Discover Insights in Tableau Pulse(Link opens in a new window) and Turn on enhanced Q&A (Discover) in Tableau(Link opens in a new window).
Better semantic matches in any language for Ask Q&A
Turning on this setting enhances semantic matching for any language when you use Ask Q&A. When this setting is on, questions and insights text are sent to OpenAI as part of semantic matching. All calls to OpenAI go through the Einstein Trust Layer(Link opens in a new window). For more information, see Turn on better semantic matches for Ask Q&A in Tableau(Link opens in a new window)
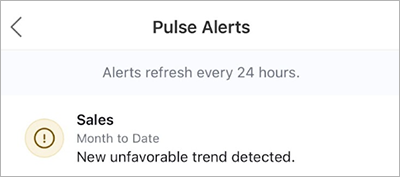
Get alerts for new unfavorable trends
If Tableau Pulse detects a new unfavorable trend in the data for a metric that you follow, you receive an alert about that trend in your email and Slack digests. If you use Tableau Mobile, you also receive a notification on your mobile device. For more information, see Get Alerts About Tableau Pulse Insights.
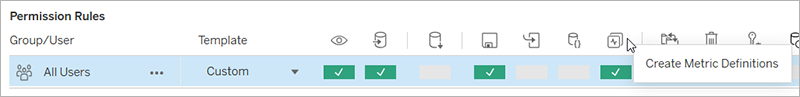
Control who can create metric definitions from a data source
Data sources have a new Create Metric Definitions permission capability. With this capability, you can now separately control who can create metric definitions from a data source and who can view metrics that use that data source. For more information, see Permissions for creating metric definitions.
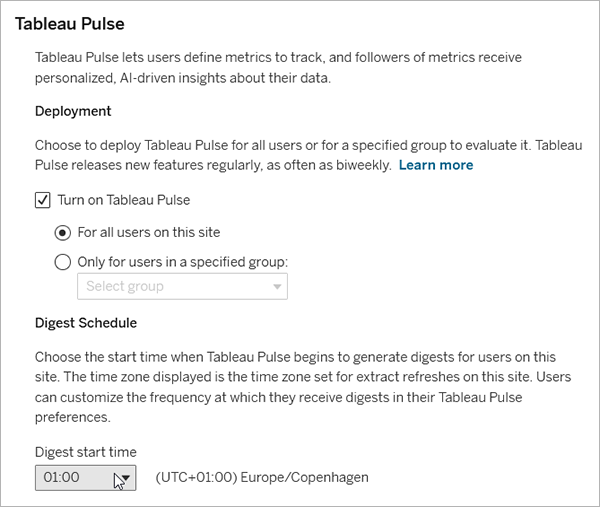
Adjust when Tableau Pulse starts generating digests
Tableau site administrators can set the time at which Tableau Pulse starts generating email and Slack digests. That way, if your data refreshes at a specific time, the digests reflect the freshest data. For more information, see Set the digest start time.
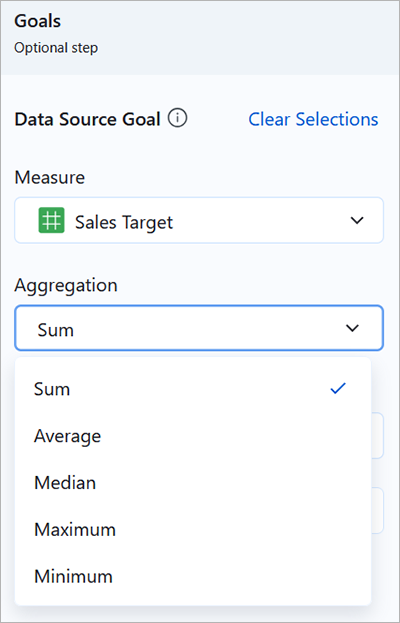
Set the aggregation type for data source goals
You can now choose how Tableau Pulse aggregates the data for a data source goal. Measures can be aggregated as a sum, average, median, maximum, or minimum, and dimensions can be aggregated as a count or distinct count to produce a measure. Previously, all data source goals were aggregated as a sum. Additionally, you can now set data source goals for metric definitions that use any aggregation. Previously, you could create data source goals only for metric definitions where the measure was aggregated as a sum or count. For more information, see Configure data source goals and thresholds.
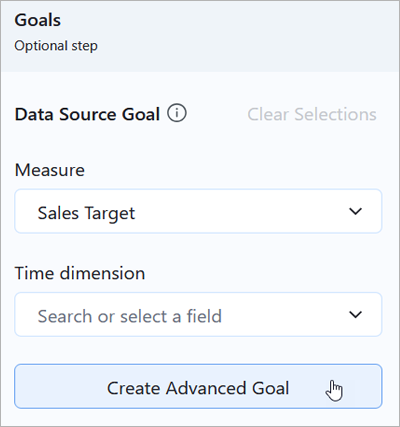
Create an advanced data source goal
The advanced editor lets you create data source goals using the familiar Tableau viz authoring environment. You can use the advanced editor to create goals based on calculated fields. For more information, see Configure data source goals and thresholds.
Other articles in this section
- Set Up Your Site for Tableau Pulse
- Create Metrics with Tableau Pulse
- Explore Metrics with Tableau Pulse
- Set Manual Goals and Thresholds with Tableau Pulse
- Ask Questions and Discover Insights in Tableau Pulse
- The Insights Platform and Insight Types in Tableau Pulse
- Get Alerts About Tableau Pulse Insights
- Work with Tableau Pulse Metrics and Dashboards
- Set Up the Pulse for Salesforce App