Create Metrics with Tableau Pulse
Tableau Pulse provides insights about your data based on metrics that you define. After you create a metric, you can add members of your organization as followers, and they'll receive regular email or Slack digests about their data. This digest surfaces trends, outliers, and other changes, keeping followers up to date on the data relevant to their work. To learn more about the data, these users can investigate a metric on Tableau Cloud and see how different factors contribute to changes in the data. These insights give them the information they need to make data-driven decisions without requiring them to do complex analysis in Tableau.

Metric definitions and metrics
Behind every metric in Tableau Pulse is a metric definition. Viewers interact with metrics. Metric definitions specify the core metadata for those metrics.

Metric definitions are the set of metadata that functions as the single source of truth for all the metrics based on them. Defined by a user with a Creator, Site Administrator Explorer, or Explorer (can publish) site role. The following table provides an example of the metadata captured by a metric definition.
| Definition field | Example value |
|---|---|
| Name | Superstore Sales |
| Measure and aggregation | Sum of Sales |
| Time dimension | Order Date |
| Compared to | Prior year |
| Adjustable metric filters | Region, Category |
| Number format | Currency |
| Data source goal measure | Sales Target |
| Granularity of goal measure | Daily |
| Value going up is | Favorable |
Metrics are the interactive objects that sit in front of a definition. Created when users adjust filters or time options, which means that there can be many metrics based on a definition. Users follow and explore metrics to get insights. The following tables provide an example of the options configured for metrics. These options are applied on top of the core value that is specified by the metric definition.
| Metric option | Example value |
|---|---|
| Time period | Quarter to date |
| Filters | Category: Technology |
| Manual goal | 80K |
| Metric option | Example value |
|---|---|
| Time period | Year to date |
| Filters | Category: Office Supplies |
| Manual goal | 200K |
To get started in Tableau Pulse, you create a metric definition that captures the core value that you want to track. At its most basic level, this value is an aggregate measure tracked based on a time dimension. The definition also specifies options such as the dimensions that viewers are able to filter by, the way the value is formatted, and the types of insights displayed.
When you create this definition, Tableau automatically creates an initial metric and sends you to that metric's page. The initial metric created for a definition has no filters applied, but any time you or another member of your organization adjusts the metric filters or time options in a new way, Tableau Pulse creates an additional metric.
People in your organization follow metrics, not metric definitions. By following individual metrics, they get insights specific to the dimensions that matter to them. The definition exists in order to let you manage the data for metrics from a single parent object. If a field in your data source changes, you can update the definition to reflect this change, and all metrics based on that definition will also reflect the change.
Say that you're a member of a sales organization, and that organization needs to track metrics across different territories and product lines. In Tableau Pulse, you would create a metric definition that includes the core value of the sum of daily sales with adjustable metric filters for region and product line. Then, you would create metrics for each region and product line. Finally, you would add members of your organization as followers to the metrics that cover where and what they sell.
What makes Tableau Pulse different
Tableau Pulse presents a simplified way to create metric definitions, so that with only a few selections, you can make a definition that would normally require complex calculations to build in traditional Tableau viz authoring. Members of your organization use that metric definition as a jumping off point to make metrics relevant to their needs, by slicing the data based on different dimensions or time options. Because insights about these metrics are sent directly to followers, your colleagues get the data they need in their flow of work.
With Tableau Pulse, users have an easy, self-service way to take part in guided data exploration. They can ask suggested questions to see how different dimensions affect the data. This guided exploration complements the more free-form analysis that's possible with the traditional Tableau viz authoring experience and allows users unfamiliar with Tableau analysis to understand their data.

Note that though some parts of Tableau Pulse are similar to other Tableau features, Tableau Pulse combines metrics and insights in an all-new experience. In February 2024, with the release of Tableau Pulse, Ask Data and Tableau's legacy Metrics feature were retired. Like Ask Data, Tableau Pulse lets you ask questions of your data, so you can learn the how and why behind the numbers you see. Tableau Pulse also lets you create and track metrics, like the legacy Metrics feature, but Tableau Pulse metrics don’t stand alone. These metrics are the source of insights about your data.
Data source requirements for metric definitions
You create a metric definition by connecting to a published data source. Make sure that the data source you're working with meets the following criteria.
- It’s a single published data source. You can't connect to a data source that is embedded in a workbook, and you can't connect to multiple data sources or use data blending, unless you combine the data before publishing the data source. The data source can be an extract or a live connection, and it can use a virtual connection or connect directly to the data.
- You have the Connect and View permission capabilities for the data source.
- The data source contains:
- A measure to be aggregated as a sum, average, median, maximum, or minimum or a dimension to be aggregated as a count or count (distinct).
- A time dimension for the metric's time series. Tableau Pulse monitors data over time, so single point-in-time values won’t produce a valid metric. The granularities supported for the time series are day, week, month, quarter, and year. Data that requires a lower level of granularity (hour or minute) isn’t a good fit for Tableau Pulse.
- At least one dimension that can be used to filter the data and insights.
Tableau Pulse displays the dimension names and values that you add as filters on metrics and in insights text. These names and values in your data source should be easy for others to understand. To create the best experience for viewers, follow these recommendations so that the names and values fit with the conversational language of Tableau Pulse.
- Use title-style capitalization rather than all caps.
- Use spaces rather than hyphens or underscores to separate words.
- Don’t use special characters.
- Don’t use Boolean fields that appear as
trueorfalse. - Don’t use fields that consist of IDs or other indecipherable strings.
Requirements for custom calendars
Set a custom calendar in Tableau Pulse if your organization doesn’t use a standard Gregorian calendar. For example, you can define a calendar that aligns with the National Retail Federation 4-5-4 calendar(Link opens in a new window).
A custom calendar must be defined in your data source, and all of the calendar fields must belong to the same table. The custom calendar doesn’t need to belong to the same table as your metric data. If the custom calendar is in a separate table, create a relationship between that table and the metric data table.
Don't add row-level security or data source filters that remove dates from the calendar table. If you add a filter to the transactions table in your data source, make sure that the filter scope is set to only that table and not that table and related tables. For information about setting the scope for data source filters, see Create a data source filter.
Each row of the custom calendar represents a date and contains these fields.
- Reference date
- The standard Gregorian date that you're mapping to the custom calendar
- Data type: date
- Example: 01/01/2025
- Day of year
- Data type: number (continuous dimension)
- Example: 333
- Week of year
- Data type: number (continuous dimension)
- Example: 48
- Month of year
- Data type: number (continuous dimension)
- Example: 11
- Month name
- Data type: string
- Example: December
- Quarter
- Data type: number (continuous dimension)
- Example: 4
- Year
- Data type: number (continuous dimension)
- Example: 2024
The format for dates in Tableau varies based on the locale that a user has set, and some fields aren't used in all locales. For example, locales set to Japanese or Chinese show the "month of year" instead of the "month name."
After you add the custom calendar to your data source, you configure the calendar as part of the metric definition. For more information, see Set a custom calendar.
Custom calendar validation
Make sure that the custom calendar is complete, consistent, and doesn’t skip any dates or numbers. Follow these guidelines to ensure that your custom calendar is valid.
- All of the fields are present for each reference date.
- The fields are of the correct data type.
- The first entry in the table is the first reference date.
- The reference dates are in chronological order.
- The reference date includes every day of the year, even if there's no business data for that day.
- The day of year, week of year, month of year, and quarter of year begin with 1 and increase by 1 with no skipped numbers.
- There are 7 days in a week. If a year ends with a partial week, the next year must begin with a partial week such that the 2 weeks add up to 7 days. For example, if week 53 of a year has only 2 days, then week 1 of the next year must contain 5 days to form a 7 day week, and week 2 would contain days 6-12.
- The month name is the same for each month number across all years in the calendar.
- There are 4 quarters in a year.
- Each quarter starts and ends with a complete month. Months can’t be split across quarters.
- The data contains the 2 previous calendar years. Metrics with a comparison to the prior year use those dates to determine the correct comparison.
- The data is complete through the end of a custom year. If future data goes into a new custom year, include the complete set of dates for that year, but don't include more than 4 years beyond the end of the current custom year.
Tableau Pulse validates the fields in the custom calendar. If there's a problem with your custom calendar, you’ll see an error that helps you troubleshoot the calendar.
| Problem | Error message example |
|---|---|
| Skipped reference date | There is a skipped reference date for the date before Feb 1, 2026. The custom calendar must include every date in a year. |
| Duplicate reference date | There is a duplicate entry for Feb 1, 2026. Each reference date must appear only once. |
| Skipped day of year | There is a skipped day of year on Feb 1, 2026. The day of year must increase by 1 with no skipped numbers. |
| Skipped week of year | There is a skipped week of year on Feb 1, 2026. The week of year must increase by 1 with no skipped numbers. |
| Incomplete week of year | There is an incomplete week of year for the week before Feb 1, 2026. A week must have 7 days. |
| Not enough days in the year for the week of year to be possible | The week of year on Feb 1, 2026 isn’t valid. A week must have 7 days. |
| Skipped month of year | There is a skipped month of year on Feb 1, 2026. The month of year must increase by 1 with no skipped numbers. |
| Inconsistent month name | There is an inconsistent month name on Feb 1, 2026. The month name must be the same for each corresponding month of year. |
| Missing month name | There is no month name on Feb 1, 2026. All fields are required for every reference date. |
| Duplicate month name | The month name on Feb 1, 2026 is already in use for another month number. The month name must correspond to a single month number. |
| Skipped quarter | There is a skipped quarter on Feb 1, 2026. The quarter must increase by 1 with no skipped numbers. |
| Not enough quarters | There are fewer than 4 quarters for the year that ends on Jan 31, 2026. A year must have 4 quarters. |
| Extra quarter | There are more than 4 quarters in a year starting on Jan 31, 2026. A year must have 4 quarters. |
| Not enough months in the year for the quarter to be possible | The quarter starting on Feb 1, 2026 isn’t valid. The quarter can’t be greater than the month of year. |
| Skipped year | There is a skipped year on Feb 1, 2026. The year must increase by 1 with no skipped numbers. |
| Field doesn’t start at 1 | The first day of year, week of year, month of year, or quarter has a value other than 1 for the year starting on Feb 1, 2026. These fields must begin with 1 at the start of a year. |
| Value is less than 1 | The day of year, week of year, month of year, or quarter is 0 or a negative value on Feb 1, 2026. This field must begin with 1. |
| Calendar ends before the current date | The custom calendar ends on Nov 30, 2025 and doesn't cover the current period. Include reference dates through the end of the current custom calendar year. |
Example custom calendar
To understand how to structure your custom calendar, download an example custom calendar. The table below shows ten rows from the example custom calendar.
| Reference date | Day of year | Week of year | Month of year | Month name | Quarter | Year |
|---|---|---|---|---|---|---|
| 01/01/2025 | 333 | 48 | 11 | December | 4 | 2024 |
| 01/02/2025 | 334 | 48 | 11 | December | 4 | 2024 |
| 01/03/2025 | 335 | 48 | 11 | December | 4 | 2024 |
| 01/04/2025 | 336 | 48 | 11 | December | 4 | 2024 |
| 01/05/2025 | 337 | 49 | 12 | January | 4 | 2024 |
| 01/06/2025 | 338 | 49 | 12 | January | 4 | 2024 |
| 01/07/2025 | 339 | 49 | 12 | January | 4 | 2024 |
| 01/08/2025 | 340 | 49 | 12 | January | 4 | 2024 |
| 01/09/2025 | 341 | 49 | 12 | January | 4 | 2024 |
| 01/10/2025 | 342 | 49 | 12 | January | 4 | 2024 |
Requirements for data source goals and thresholds
There are two ways to set goals and thresholds: manually or as part of the data source. A manual goal or threshold is simply a static number entered for an individual metric, so there are no data source requirements. A data source goal or threshold is set at the definition level. These goals or thresholds use a field from your data source to show a dynamic value on the metrics based on that definition. For more information, see Configure data source goals and thresholds and Set Manual Goals and Thresholds with Tableau Pulse.
If you want to include a data source goal or threshold as part of a metric definition, there are additional data source considerations.
- Include the field that specifies the goal or threshold values as part of the data source that the definition connects to. Metric definitions connect to only a single data source, so you can’t connect to a separate data source for this data.
- If the goal or threshold data is in a separate table from the core definition data, create a relationship between the two tables. If you join the tables instead of relating them, the data source might end up with duplicate goal or threshold values. For information about relating data, see Use Relationships for Multi-table Data Analysis.
- If you want a finer-grained goal or threshold to be shown when users apply dimensional filters on metrics, include that level of granularity in your data. Otherwise, Tableau Pulse displays the total goal or threshold value for a dimension, even if the data is filtered to a subset of values.
These two tables show example data sources with goals of different granularity. If there isn’t goal or threshold data for each row, for example in the case where there is only a monthly goal, include that value only once. Don’t duplicate the value in each row.
| Date | Account Executive | Sales | Sales Target (Daily) |
|---|---|---|---|
| 06/01/2025 | Fred Suzuki | 658 | 600 |
| 06/01/2025 | Jane Johnson | 505 | 700 |
| 06/01/2025 | Laura Rodriguez | 623 | 650 |
| 06/02/2025 | Fred Suzuki | 678 | 600 |
| 06/02/2025 | Jane Johnson | 527 | 700 |
| 06/02/2025 | Laura Rodriguez | 656 | 650 |
| 06/03/2025 | Fred Suzuki | 607 | 600 |
| 06/03/2025 | Jane Johnson | 753 | 700 |
| 06/03/2025 | Laura Rodriguez | 558 | 650 |
| Date | Account Executive | Sales | Sales Target (Monthly) |
|---|---|---|---|
| 06/01/2025 | Fred Suzuki | 658 | 15000 |
| 06/01/2025 | Jane Johnson | 505 | 17000 |
| 06/01/2025 | Laura Rodriguez | 623 | 16000 |
| 06/02/2025 | Fred Suzuki | 678 | |
| 06/02/2025 | Jane Johnson | 527 | |
| 06/02/2025 | Laura Rodriguez | 656 | |
| 06/03/2025 | Fred Suzuki | 607 | |
| 06/03/2025 | Jane Johnson | 753 | |
| 06/03/2025 | Laura Rodriguez | 558 |
Configure the core definition
After making sure that your data source will work with Tableau Pulse, you're ready to start creating your definition. The definition editor is optimized for larger screens, so you should create your definition using a desktop or laptop computer rather than a mobile device.
To create metric definitions, you need a Creator, Site Administrator Explorer, or Explorer (can publish) site role on Tableau Cloud. If you have a Viewer site role, you can follow metrics and discover insights, but you can't create metric definitions.
-
From the Tableau Pulse home page, select New Metric Definition.
-
Select a data source to connect to, then select Connect.
-
For the Name, enter a name that isn't in use by other metric definitions.
This name appears on all metrics based on the definition, so choose a name that's easy for others to understand.
-
For the Description (optional), provide brief details to help others make sense of the data.
The description appears on the definition page. On the insights exploration page for each metric, the description shows when users select the info icon.
-
For Links (optional), add up to five links. These links appear on a metric’s insights exploration page. The links must begin with
https://.
Define the metric value
-
For the Measure, select the field to track.
You can select a measure or a dimension, but dimensions must be aggregated as a count or count (distinct) so that they result in a measure that can be tracked.
-
For the Aggregation, select how Tableau Pulse should aggregate the field you're tracking.
If you require a more complex aggregation, see Create an advanced definition.
-
For the Temporality, select Over time or Latest point in time.
The temporality setting controls whether the metric value and the value for the points on a metric chart are cumulative over the period or a snapshot value for the latest date. For example, a metric with a month-to-date time period and an over-time temporality would, on the 15th day of the month, show a cumulative value for days 1–15. That same metric with a point-in-time temporality would show a value that captures the data as it stands on the 15th.
This setting also affects the options that are available for the Show sparkline values to date setting. Metrics with a point-in-time temporality always have a non-cumulative chart. In addition to the overall chart being non-cumulative, for a point-in-time temporality, each point on the metric chart shows the value for the latest date in the period covered by that point. So for a chart where each point represents a week of data, the value is for the last date in that week.
-
For Show sparkline values to date as, select whether you want the points on the metric chart to display as a running total or as non-cumulative values.
This setting applies to the sparkline, the overview line chart, and applicable insights. For metrics that are sums, the current value shown at the top of the metric will always be a running total for the period you're tracking.
-
For the Definition filters (optional), select values to limit the metric data.
Definition filters affect the data for all metrics based on the definition and aren't adjustable by the viewer. Fields added as definition filters change the meaning of the definition. For example, a definition filter might exclude returned orders to define net sales. If you simply want to use a field to segment the data, add an adjustable metric filter, available under the Options section. For more information, see Define metric options.
- For the Time dimension, select the field to define the time series. In March 2025, the advanced time settings moved to the Time step. To configure those options, see Configure time settings.
How fiscal calendars work with metrics
If your time dimension is configured to use a fiscal calendar, Tableau Pulse uses that calendar. The metrics based on a definition with a fiscal calendar show fiscal years and fiscal quarters on charts and insights. When you create a definition, the fiscal start month is listed under the time dimension field, if one is set. You can't adjust the fiscal calendar in Tableau Pulse. To change it, edit the data source used by the definition. For more information, see Fiscal Dates.
Create an advanced definition
If you prefer the flexibility of working in the traditional Tableau viz authoring environment, or if you need to create calculated fields, use the advanced analytics editor. Using the advanced analytics editor is optional.
-
On the definition panel, select Create Advanced Definition.
-
Add fields to the measure, time dimension, and filters shelves.
Only the fields, including calculated fields, that you add to these shelves are saved by the editor. Number format changes, granularity adjustments, or table calculations made in the advanced editor don't carry over. Instead, use the definition settings to set a minimum time granularity or change the number format.
-
Select Apply.
The fields you added in the editor replace the equivalent fields in the definition panel. To edit these fields, reopen the editor. You can't edit fields configured in the advanced analytics editor in the definition panel.
Define metric options
-
For Adjustable metric filters, add at least one option.
These filter options appear on metrics and allow users to scope the data to meet their needs. Filtering creates additional metrics from a definition. The first 20 fields that you add as adjustable metric filters also determine the dimensions used to generate insights about the data. If you add more than 20 fields, those options still appear as filters, but they aren't used to generate insights or available as breakdown options.
-
For the Number format, you can specify custom units to show for the value, or you can set the value to display as currency or as a percentage.
-
For Decimal places, select the number of decimal places to show for metric values. By default, Tableau Pulse automatically determines the number of decimal places to show. As numbers get larger, Tableau Pulse shows fewer decimal places.
Configure time settings
The time settings are optional and let you adjust the time series and comparisons for metrics so that they fit your data.
Set a date offset
A date offset changes the final point in a metric’s time series from today to a day in the past. An offset is useful if the data in the metric’s data source refreshes at a delay. Otherwise, if there isn’t any data for the final point in the time series, a metric shows a null value.
There are two types of offsets: fixed and dynamic. A fixed offset shifts the end of the time series a specified number of days. A metric with a fixed offset of 2 days shows the time period “2 Days Ago” instead of “Today.”
A dynamic date offset automatically adjusts to show the most recent date with data instead of “Today.” So if the data source doesn’t update for several days, the offset increases to continue showing the most recent date with data.
-
For the Date offset, select Fixed or Dynamic.
-
For a fixed offset, enter the number of days to shift the time series by.
Write calculated fields that work with dynamic offsets
If the measure for a metric definition uses a calculation to aggregate multiple fields, any of those fields having a null value for a date will result in the aggregate value for that date being null. A dynamic offset skips dates that have a null value to find the most recent date with data.
To make sure that Tableau Pulse doesn’t skip over dates that do have data, use an IF statement in the calculation to identify any dates that have at least one non-null field, and then apply the ZN (zero if null) function. The ZN function transforms the null values to zeroes so that they can be aggregated with the other fields that do have data, and the dynamic offset then identifies that date as having data. For more information about these functions, see Number Functions (ZN) and Logical Functions (IF).
Set the minimum granularity
The minimum granularity controls the time options available when users filter metrics. That way, users can’t select options that have no data.
-
For the Minimum time granularity, select a larger granularity if smaller units like day or week don’t make sense based on your data.
Customize the comparison
-
For Time comparison > Primary, select Prior period to compare to the prior day, week, month, quarter, or year, or select Prior year to compare to the same time range a year ago. The primary time comparison is displayed in digests and insights and on the metric overview card.
-
For Time comparison > Secondary, if you don't want metrics to show a secondary comparison, select None. The secondary comparison appears in addition to the primary comparison on a metric's insights exploration page.
Set a custom daily comparison
A custom daily comparison allows you to override the standard comparison for metrics that have a time range of “Today” or “Yesterday.” A custom comparison requires two fields in your data source: the custom daily comparison and the reference date. The reference date defines which dates show a custom comparison, and the custom daily comparison supplies the alternative dates. The fields for the reference date and the custom daily comparison must belong to the same table in the data source.
Use this setting to compare events that don’t fall on a consistent date each year. For example, you can compare Black Friday this year to Black Friday a year ago. Without a custom comparison, a metric showing data for November 28, 2025 shows a prior year comparison to November 28, 2024. With a custom comparison, you can specify a daily comparison of November 29, 2024 for the reference date of November 28, 2025. That way, Tableau Pulse compares sales data for the same event.
-
For Custom daily comparison, select a date field. This field contains the alternative dates for the daily comparison.
-
For Reference date, select a date field. This field determines which dates show a custom comparison. You can reuse the time dimension from the core definition as long as it belongs to the same data table as the custom daily comparison.
Set a custom calendar
The calendar must be defined in your data source, and all of the calendar fields must come from the same table. For more information, see Requirements for custom calendars.
- Under Calendar, select Set Calendar.
- Select the fields in your data source that define the custom calendar.
- Day of year (data type: number)
- Week of year (data type: number)
- Month of year (data type: number)
- Month name (data type: string)
- Quarter (data type: number)
- Year (data type: number)
- Reference date (data type: date)
- Select Apply.
Configure data source goals and thresholds
Configuring a data source goal or threshold is optional. For information about structuring your data source for goals and thresholds, see Requirements for data source goals and thresholds.
A data source goal or threshold uses a field from your data source to show dynamic goal or threshold values on metrics. For goals, Tableau Pulse shows a metric’s progress toward the goal value. If the pace to goal insight is turned on, you also see whether the metric is expected to meet the goal by the end of the period. For thresholds, Tableau Pulse shows how far the metric is from the threshold value.
Data source goals or thresholds appear on all metrics based on a definition. The goal or threshold value is filtered by the filters applied to a metric if data exists for that level of granularity. If data doesn’t exist for specific values or dimensions, Tableau Pulse displays the goal or threshold value for a higher level of detail that does have data. That higher-level goal or threshold value might not be relevant for the filtered metric, so make sure that your data source has data of the appropriate granularity.
-
On the Goal and Threshold step, select the Type. You can configure either a goal or a threshold, but not both.
-
For Measure, select the field from your data source to use for the goal or threshold value.
-
Data source goals and thresholds inherit the definition filters from the core definition unless those filters were set in the advanced editor. If the definition filters weren’t inherited, add any relevant filters.
-
For Aggregation, select how the data is aggregated for time periods that are greater than the goal granularity.
-
For Time dimension, select the field to use for the time series.
-
For Minimum granularity, select the level of detail represented by each row of the measure. Metrics with time ranges smaller than this granularity don’t show a goal or threshold.
-
If you’re setting a threshold, for the Unfavorable Range, select whether above or below the threshold is unfavorable. The unfavorable range is shaded red on the metric chart. When the aggregate metric value crosses into this range, followers receive an alert. For more information, see Get Tableau Pulse Alerts.
-
To change the label for the goal or threshold, under Custom goal label, enter a name. This custom label appears on the goal progress indicator, chart, and in insights.
Advanced goals and thresholds
To configure a data source goal or threshold that uses calculated fields, create an advanced goal or threshold. The advanced analytics editor lets you use the familiar Tableau viz authoring environment to create calculations that define your goal or threshold.
With the advanced editor, you can write calculations using fields from your data source, or you can write calculations that define static numeric values for goals or thresholds. These static values appear on all metrics based on the definition. If you define static values, you can use logical functions to define how the values correspond to different conditions. For example, use if statements to define the goals or thresholds that appear for specific filter values. For more information about writing logical calculations, see Logical Functions.
Manual goal and threshold overrides
A manual goal or threshold is a single number that anyone with permission can set on an individual metric. If someone sets a manual goal or threshold on a metric, that value overrides any data source goal or threshold. If the manual override is removed, the data source goal or threshold appears again. To learn about manual goals and thresholds, see Set Manual Goals and Thresholds with Tableau Pulse.
Configure insights
-
Select the Insights tab.
The fields under Insight dimensions are the same fields that you added as adjustable metric filters. Tableau Pulse uses these dimensions when monitoring your data to surface relevant insights, as shown in the insights preview.
-
For Value going up is, select whether the change is neutral, favorable, or unfavorable.
This option controls the color for the change value: blue for neutral, green for favorable, and red for unfavorable. It also affects the language used in insights that refer to the change.
-
You can select which insights are shown for metrics by turning them on or off. Under Insight types, select Turn On or select the … menu then select Turn Off to adjust the types of insights shown. Hover over the info icon for a description of each type.
Correlated Metrics: When this insight is turned on, you will need to select up to five metric definitions that can be considered for correlation with the metric you are defining. The correlated metrics insight appears only for a metric designated as a correlation candidate if the correlation coefficient between two metrics is 0.7 or greater. Additionally, the correlation must be found in the period that the metric covers or that you are asking about, in the case of Tableau Agent in Pulse.Select Add Candidates.
In the Manage Correlation Candidates dialog box, select metric definitions that you want Tableau Pulse to watch for correlations. Try to select metric definitions of interest that don't already have an obvious causal relationship.
Select Apply when you are done.
Record-level Outlier: When this insight is turned on, it requires additional configuration.-
For the Record identifier, select a field in your data that has a unique value for every record, for example, Order ID.
-
For the Record identifier name (optional), select a field in your data that has a name that corresponds to the record identifier, for example, Order Name.
-
For Singular and Plural (optional), add names for the records as they should appear in insights text, for example Order and Orders.
-
Verify that the metric and insights previews look as expected, then select Save Definition.
Tableau Pulse creates the definition along with the initial metric based on that definition, which has no adjustable metric filters applied. You can find your definition under the Browse Metrics tab on the Tableau Pulse home page.
For an overview of insight types and the insights platform, see The Insights Platform and Insight Types in Tableau Pulse.
Configure governance
The governance settings for a metric definition are optional.
Certify the definition
Metrics based on certified definitions show a badge that indicates their trusted and recommended status. Certify a metric to tell others that they can rely on that data to make business decisions.
- Under Endorsement, turn on the Certified definition toggle.
To certify a metric definition, you must have the Create Metric Definitions permission capability for the data source that the definition is connected to. Certifying a metric definition is a separate action from certifying a data source, and data source certification doesn’t appear on metrics. To learn about certified data sources, see Use Certification to Help Users Find Trusted Data.
Restrict editing for definitions and manual goals and thresholds
By default, any user with the correct site role can edit or delete a metric definition. All users can set, edit, or delete manual goals or thresholds for the metrics based on that definition. You can restrict these actions to specific users and groups. Tableau administrators always have permission to edit because their site role gives them access.
Users with the site role of Creator, Site Administrator Explorer, or Explorer (can publish) can edit metric definitions. If you give a Viewer access to edit a definition, that user won’t be able to edit the definition because the site role doesn’t allow it. The ability to edit manual goals and thresholds isn't limited by site role.
-
Under Edit definition or Edit manual goals and thresholds, select Anyone Can Edit.
-
Select the Restrict editing toggle.
-
Enter the users and groups to add as editors.
-
Select Add.
-
Close the Manage Editors dialog.
Create metrics
After you create your definition, you’ll be taken to the initial metric for that definition. This page is the insights exploration page for that metric. On it, you can see insights based on dimensions that you select, and you can create more metrics by adjusting filters.
-
On a metric for your definition, select Filter. The filter labels become interactive.
-
Select the buttons to change the time and filter options.
-
Select the check mark button. If a metric with that combination of filters doesn’t yet exist, Tableau Pulse creates one.
To learn how viewers interact with these metrics, see Explore Metrics with Tableau Pulse.
Why is the chart for a metric incomplete?
When you create metrics with different time periods, it can reveal issues with your data. If there’s missing data for the period that the chart covers, then the metric value or the expected range might appear incomplete.
The metric value is incomplete or missing
If the metric value is incomplete, it might indicate an issue with the data, or it might be a normal consequence of the time period that the chart covers. At the beginning of the period for a period-to-date metric, the chart shows only a single point of data. If you instead want to see the most recent 7, 30, or 90 days of data, filter to show a rolling time window. If there’s no data for the current period but there’s data for previous periods, then the data source that the metric is connected to might refresh at a delay. You can set a date offset to account for this delay.
The expected range is incomplete
The expected range appears for points on the chart that have data. On non-cumulative charts, both the metric value and the expected range are missing for points without data. For metrics that show a running total, if there’s data for at least two points in the period, the chart shows a cumulative line for the metric value, but the points without data don’t have an expected range.
For metrics with a quarter-to-date time range, the quarter might start in the middle of a week. If the first week of the quarter is a partial week, then an expected range isn’t shown for that week.
Manage followers
Followers are specific to each metric, not to the metric definition as a whole. That way, individuals in your organization receive insights about only the metrics that matter to them. Any time you create a new metric, you need to add followers. Followers don’t carry over from the previous metric that you were viewing.
Add followers
-
Open the metric that you want to add followers to.
-
Select the Followers button.
-
In the search box, enter the name of the user or group that you want to add.
-
Select Add.
If users are added to a metric as part of a group, they won’t be able to remove themselves individually. If you want users to have control over the metrics they follow, add them as individuals.
Remove followers
-
Open the metric that you want to remove followers from.
-
Select the Followers button.
-
Next to the follower's name, select Remove.
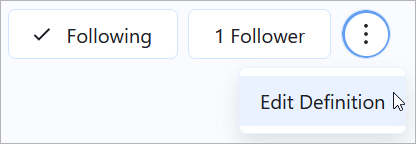
Edit a metric definition
If your data source changes, and the metrics that are based on it break, edit the metric definition to account for these changes. Any changes that you make to the definition will affect all metrics based on it.
-
Open a metric for the definition you want to edit.
-
Select the actions menu, then select Edit Definition.
How editing a definition affects metrics and goals
When you edit a definition, your changes might affect the metrics based on the definition and the goals based on those metrics.
| Changed field | Affected feature | Impact |
|---|---|---|
| Definition filters, adjustable metric filters | Metrics | If you remove an adjustable metric filter or add a definition filter that excludes a value used in a metric filter, metrics using that filter aren’t deleted. Existing followers of an affected metric are able to adjust the filter and add other followers. However, users who aren't already followers can’t follow that metric on their own.
To make it so users no longer see metrics that are based on eliminated filters, remove the followers from those metrics. Alternatively, if you want to get rid of all of the metrics for a definition, delete the definition. |
Clone a metric definition
If you need to create multiple similar metric definitions, clone an existing definition. Cloning a metric definition copies all of the configuration from the original definition except for the governance step. Because you can’t have two identical metric definitions in Tableau Pulse, you must adjust the cloned definition before you save it.
- On a metric definition page, select Clone Definition. You can also select Clone Definition from the actions (⋯) menu on a metric’s insights exploration page.
- On the Core Definition step for the cloned definition, change at least one of the measure, aggregation, time dimension, or adjustable metric filters.
- Review the other steps and make any adjustments needed.
- Select Save. A cloned definition doesn’t persist until you save it.
Delete a metric definition
Deleting a metric definition also deletes all of the metrics based on it.
-
On the Tableau Pulse home page, select the Browse Metrics tab.
-
On the metric definition that you want to delete, select the actions (...) menu, then select Delete.
Add metrics to dashboards and create metrics from dashboards
For information about the Pulse metric dashboard object and recommendations for metrics based on dashboard data, see Work with Tableau Pulse Metrics and Dashboards.
Embed metrics
You can use the Embedding API to embed Tableau Pulse metrics in web pages. For more information, see Embed Tableau Pulse(Link opens in a new window).