About Tableau Pulse
With Tableau Pulse, users receive personalized data insights about metrics that they follow. These insights are sent directly to users in Slack and email digests, giving them access to the data they need in the tools they already use. If users want to learn more about their data, they can visit a metric's insights exploration page on Tableau Cloud. On that page, users can engage in guided data analysis to understand what is driving changes to their data.
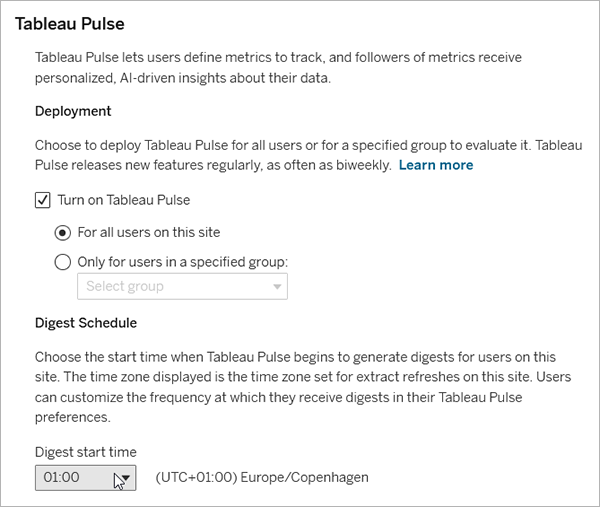
Tableau Pulse is available for Tableau Cloud. To get a site ready for Tableau Pulse, a site administrator must first turn on the setting and make sure that there's appropriate data to work with. Then, users can create metric definitions, which specify the core metadata for metrics. Users create metrics based on these definitions by adjusting filter and time options to scope the data in ways that are useful for different groups of followers.
The articles here help you get started with Tableau Pulse, whether you're a Tableau administrator setting up your site, a Creator defining the metadata that metrics are based on, a Viewer exploring existing metrics, or a developer embedding metrics.
| Article | Audience | About |
|---|---|---|
| Set Up Your Site for Tableau Pulse | Site Administrators | Settings, permissions, and requirements for Tableau Pulse |
| Create Metrics with Tableau Pulse | Creators, Site Administrator Explorers, and Explorers (can publish) | Definitions and metrics and how to create them |
| Explore Metrics with Tableau Pulse | Creators, Explorers, and Viewers | The types of analysis you can do with existing metrics |
| Set Manual Goals and Thresholds with Tableau Pulse | Creators, Explorers, and Viewers | Goals and thresholds that let you track metric performance |
| Ask Questions and Discover Insights in Tableau Pulse(Link opens in a new window) | Creators, Explorers, and Viewers | Options for finding insights with Ask Q&A (single metric exploration) or with Tableau Agent in Pulse (grouped metric exploration powered by AI in Tableau) |
| The Insights Platform and Insight Types in Tableau Pulse | Creators, Explorers, and Viewers | The insight types available in Tableau Pulse and general information about how the Insights platform works |
| Get Tableau Pulse Alerts | Creators, Explorers, and Viewers | New unfavorable trend alerts for the metrics that you follow |
| Work with Tableau Pulse Metrics and Dashboards | Creators, Site Administrator Explorers, and Explorers (can publish) | The Pulse dashboard object and recommended metrics based on dashboard data |
| Premium Tableau Pulse Capabilities | Creators, Explorers, and Viewers | The Tableau Pulse capabilities available for Tableau+ users |
| Tableau Pulse REST API Methods(Link opens in a new window) | Developers | The API methods to create metrics, get metric details, generate insights, and more |
| Embed Tableau Pulse(Link opens in a new window) | Developers | The Tableau Embedding API web component for embedding metrics in a web page |
| Set Up the Pulse for Salesforce App | Salesforce customers | The Pulse app that Salesforce customers can purchase |
| Configure a Tableau Pulse Lightning Web Component | Salesforce customers | The Tableau Pulse Lightning web component for Salesforce Lightning pages |
| Interact with Data on Tableau Mobile(Link opens in a new window) | Creators, Explorers, and Viewers | Tableau Pulse on Tableau Mobile |
Release notes
Added July 2, 2026
See your metrics in dark mode
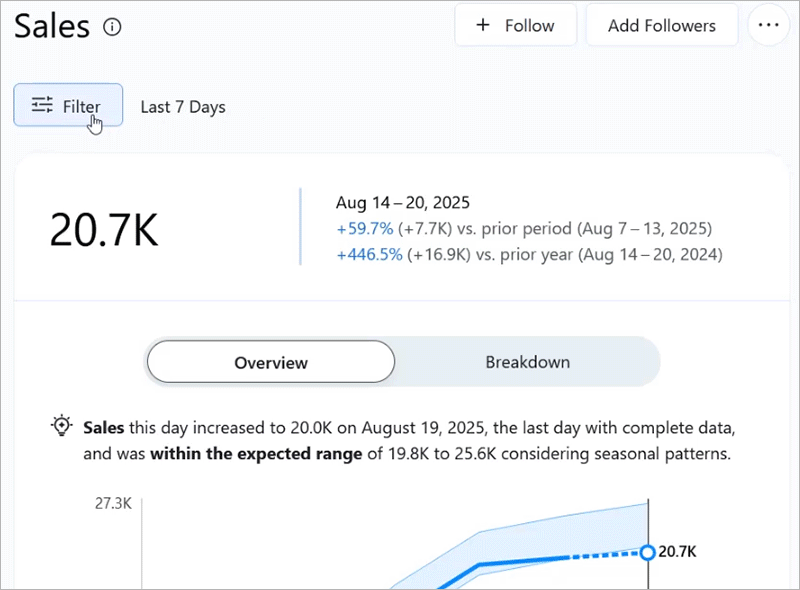
Tableau Pulse now uses the theme that you have set for Tableau Cloud. You can set your theme on your Tableau Cloud account settings page.
- To set your theme, go to the Tableau Cloud home page. If you're viewing Tableau Pulse, to navigate back to Tableau Cloud, select the arrow icon next to the Tableau Pulse title in the header.
- Select your profile icon in the upper-right corner.
- Select My Account Settings.
- Under Accessibility, for the Theme, select Dark.
- Select Save Changes.
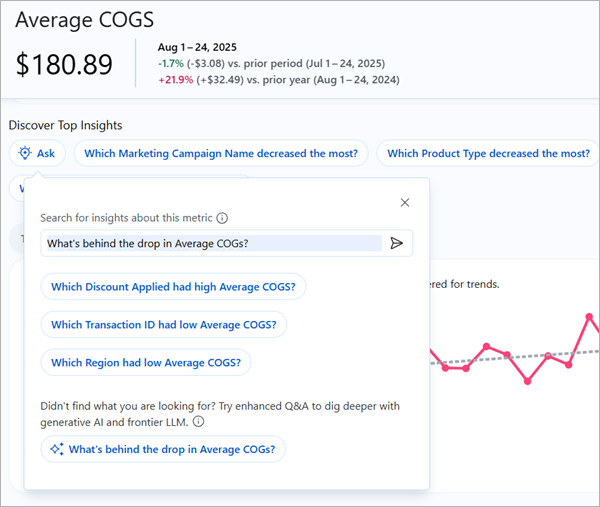
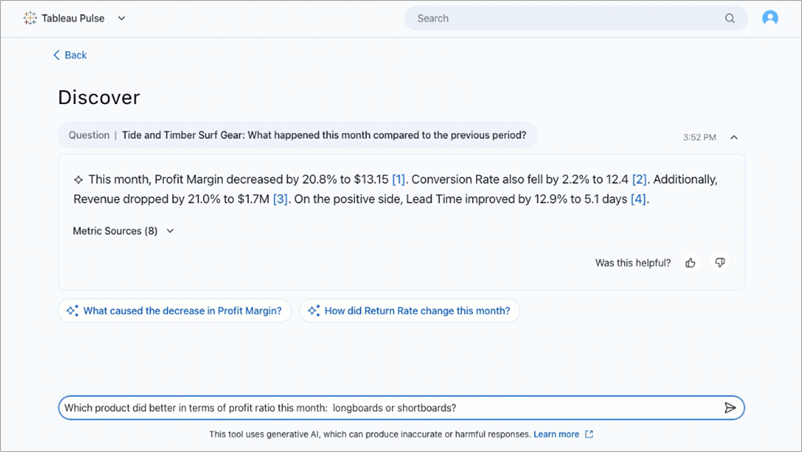
Get improved answers with an upgraded Tableau Agent in Pulse (enhanced Q&A)
Tableau Agent in Pulse (formerly known as enhanced Q&A or Discover) is now powered by GPT-5.2. This upgraded large language model allows Tableau Agent in Pulse to handle more complex data with greater accuracy when answering your questions. For more information about Tableau Agent in Pulse, see Ask Questions and Discover Insights in Tableau Pulse.
The GPT-5.2 model was selected because it’s the best fit for providing reliable and trustworthy answers for Tableau Agent in Pulse. Note that this model doesn’t analyze your data. Instead, it draws upon pre-calculated insights that are rooted in statistical analysis done by Tableau to answer questions about your metrics.
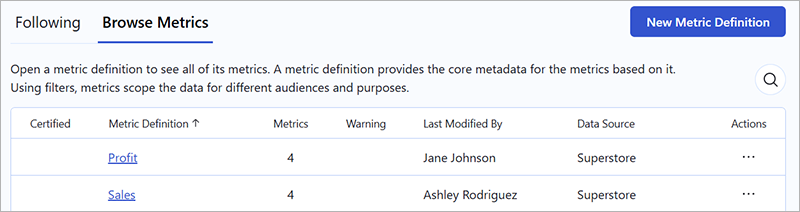
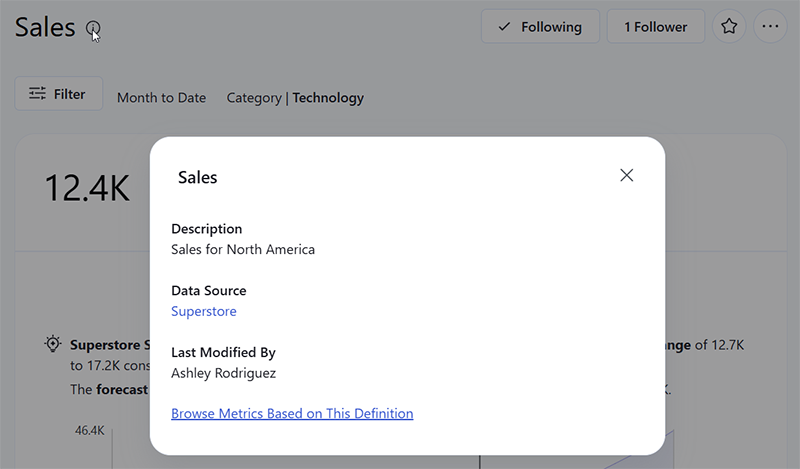
Find out who edited a metric definition
The new Last Modified By label shows the user who most recently edited a metric definition. This label appears on the Browse Metrics tab on the home page, on the page that lists metrics based on a definition, and in the metadata information for a metric.
Added June 18, 2026
Try Tableau Agent in Pulse (enhanced Q&A) for free on your existing Tableau site
If you’re a Tableau site administrator, you can now activate a trial of Tableau Agent in Pulse (enhanced Q&A) with the Try AI site setting. Try AI is the only way to test AI capabilities on an existing Tableau site. Starting the trial is as simple as activating the setting on Tableau Cloud, with no Salesforce org set up required. The trial runs for 60 days, and you can limit access to Tableau Agent in Pulse (enhanced Q&A) to specific user groups or make it available to all users on a site. To learn more, see Try Tableau Agent in Pulse.
Limit access to Tableau Agent in Pulse (enhanced Q&A)
As a Tableau site administrator, when you turn on Tableau Agent in Pulse (enhanced Q&A), you can limit access to specific user groups. This setting makes it easy for a subset of users to explore Tableau Agent in Pulse before you make it accessible to all users on a site. To learn how to adjust the site settings, see Turn on Tableau Agent in Pulse.
Note: Enhanced Q&A (Discover) has been renamed to Tableau Agent in Pulse. The functionality remains the same. Only the name has changed. You'll see the name change in upcoming releases.
Added June 4, 2026
Create point-in-time metrics to track snapshots of your data
The new temporality setting on a metric definition has two options: over time and latest point in time. This temporality setting controls whether a metric value is cumulative over the entire period or a snapshot of the data on the latest date. To learn about how to configure the core metric definition, see Define the metric value.
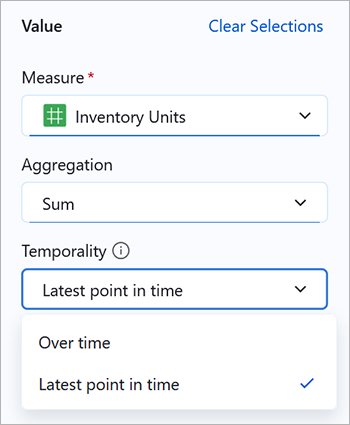
When you set the temporality to the latest point in time, the metric value is the aggregate of the data on the latest date in the period. In the case where the points on the metric chart represent more than a single day, the value for each point on the chart is for the latest date in the period represented by the point. This setting is useful for data where a cumulative metric value for the entire time period doesn't make sense, such as inventory data. A “Latest Point in Time” badge appears on metrics of this type.
![]()
Over time is the default temporality. The value for metrics with an over-time temporality is cumulative for the entire time period, and each point on a non-cumulative metric chart is the aggregate value for the period covered by that point. Prior to the introduction of the temporality setting, all metrics were of the over-time temporality unless you used the advanced editor to calculate a point-in-time metric.
Added April 14, 2026
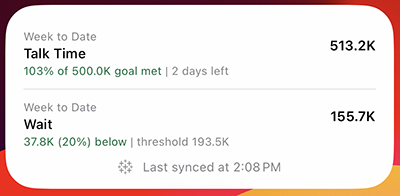
Monitor Pulse metrics on your home screen
To keep a closer eye on your favorite Pulse metrics, add the Tableau widget to your home screen. For the widget to show Pulse metrics, you’ll need to add metrics as favorites and adjust app settings so that the widget can access your data. To learn how to configure settings and select metrics for the widget, see Configure the Tableau widget to show metrics on your home screen.
Added March 26, 2026
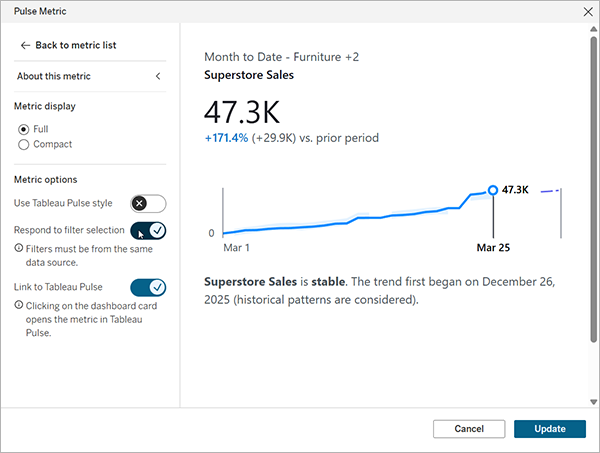
Filter Pulse metrics on dashboards
The Pulse object lets you add metrics to dashboards alongside visualizations. You can now configure the Pulse object so that it responds when you select an input filter on the dashboard. For the Pulse object to respond to a filter, the filter must be a dimension from the same data source that the metric definition connects to, and that dimension must be an adjustable metric filter on the metric definition. For information about configuring the Pulse object and about how filters work with the Pulse object, see Add metrics to a dashboard.
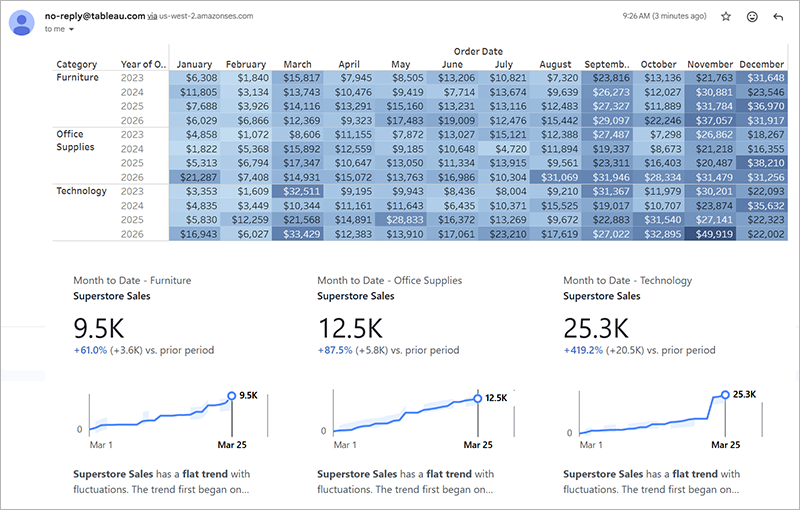
See Pulse metrics in dashboard subscription and export images
If you receive a dashboard subscription that contains an image, or if you export an image of a dashboard, Pulse metrics are now included in the dashboard image. Note that PDF and PowerPoint exports of dashboards don’t yet support Pulse metrics. To learn about subscribing to a dashboard, see Create a Subscription to a View or Workbook.
Added March 12, 2026
Get an overview of your metrics with streamlined email digests
Tableau Pulse email digests have a new layout that helps you quickly catch up with your metrics. The compact design puts key information about more of your metrics on the screen. To make sure that you receive email digests, see Manage your Tableau Pulse digest.
Understand enhanced Q&A insights with inline visualizations (Tableau+ license edition required)
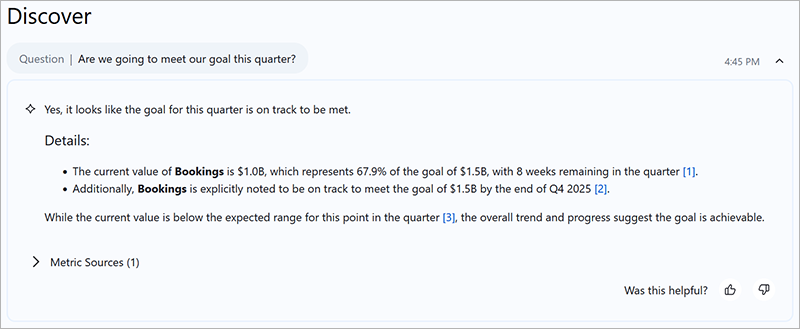
When enhanced Q&A answers your question, it provides an insight brief with citations for each insight source. That insight brief is now illustrated with an inline visualization from the most critical insight source. Previously, you needed to click on each citation to see the insight source. If there are multiple insight sources, you can still click on the citation numbers to see the other insight sources and their visualizations. For information about using enhanced Q&A, see Explore groups of metrics with Tableau Agent in Pulse.
Added February 6, 2026
Easily dig in to your data from your Tableau Pulse home page (Tableau+ license edition required)
The new Discover with AI button on the Tableau Pulse home page provides you with quick access to the enhanced Q&A experience. Enhanced Q&A, also known as Discover, is an AI-powered conversational way to investigate your data. Ask a question using natural language, and enhanced Q&A will look across the metrics in a group to uncover insights. For the Analyze with AI button to appear on your home page, your metrics must be sorted by data source or definition. For more information about enhanced Q&A, see Explore groups of metrics with Tableau Agent in Pulse.
Added January 29, 2026
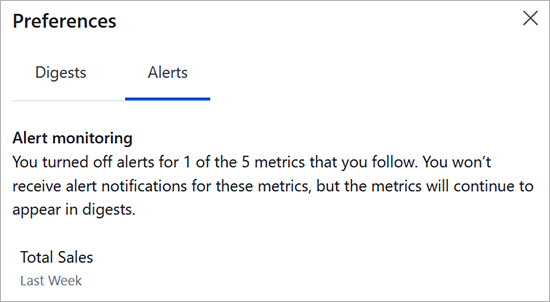
Turn off alerts for a metric
You receive an alert when a metric that you're following crosses into an unfavorable threshold range or has a new unfavorable trend. If you don't want to receive alerts for a specific metric, turn off alerts for that metric. To turn off alerts, select the actions (⋮ or ⋯) menu for that metric, then select Turn Off Alerts.
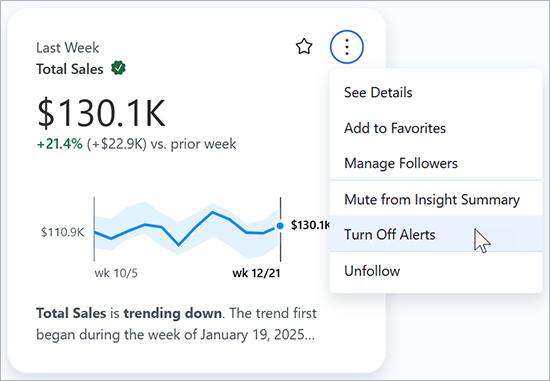
To see a list of the metrics that you’ve turned off alerts for, select your user icon in the upper-right corner of any Tableau Pulse page. Select Preferences, then select the Alerts tab. If you decide that you want to receive alerts again, click on a metric from this list to open it, select the actions menu, then select Turn On Alerts.
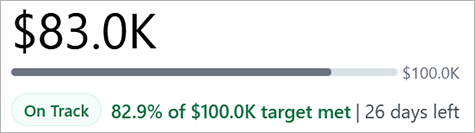
Give your goal or threshold a custom name
If the default label of “goal” or “threshold” doesn't represent your organization's data, you can enter a custom label to be shown to metric viewers. You can set a custom label for both data source goals and thresholds and manual goals and thresholds. For information about setting goals and thresholds, see Configure data source goals and thresholds and Set Manual Goals and Thresholds with Tableau Pulse.
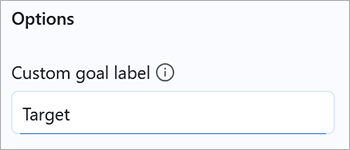
This custom label appears on the goal or threshold progress indicator, the metric chart, and in insights. For example, a goal with the custom label “target” states the amount of the target met.
Learn about correlated metrics with enhanced Q&A (Tableau+ license edition required)
You can now ask enhanced Q&A about similarities between metrics. Enhanced Q&A provides insights on the strength and direction of the correlation and whether it’s positive or negative. To access enhanced Q&A, select the Ask button on a metric, then select an enhanced Q&A question. Or, from the Pulse home page, select one of the enhanced Q&A questions for a group of metrics.
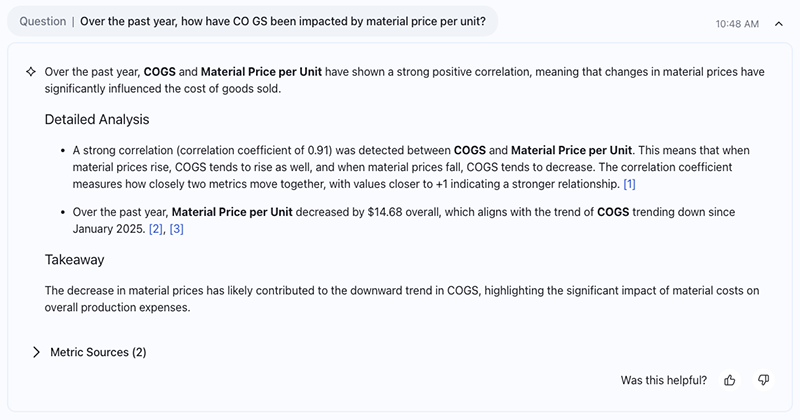
Enhanced Q&A looks for correlations only on metric definitions that have correlation candidates identified. For enhanced Q&A to explain a correlation, the correlation coefficient must be at least 0.7, and the correlation must occur within the specific time period that you ask about. For information about configuring correlation candidates, see Configure insights.
Added January 8, 2026
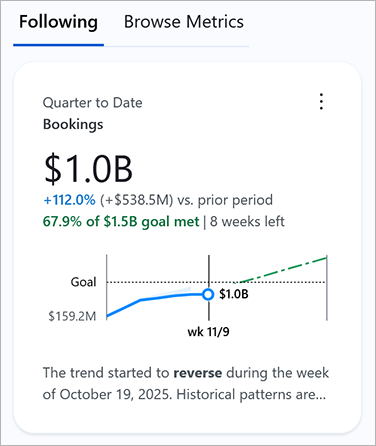
Monitor if a metric is on track to meet its goal (Tableau+ license edition required)
For metrics that have a goal set, you can now see if the metric is expected to meet its goal by the end of the current period. The on track or off track status for a metric appears next to the goal progress, and the forecast line on the chart turns green or red to reflect this status. If you don't want this information to appear on a metric, turn off the pace to goal insight type on the metric definition. For more information, see Configure insights.
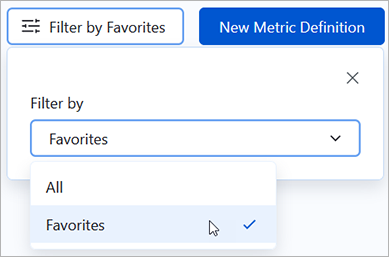
Keep track of your favorite metrics
If there are key metrics that you want to monitor, select the star icon to add them to your favorites. To add a metric as a favorite, you must be following it.
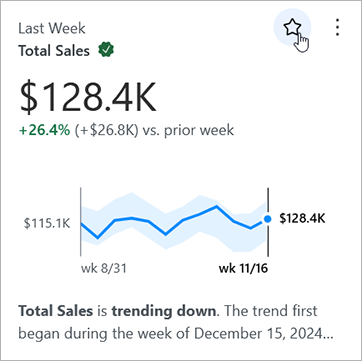
You can filter the metrics that appear on your Tableau Pulse homepage so that you see only favorites. You can also adjust your digest preferences to show only favorite metrics in email and Slack digests. Note that if you set your digests to show only favorites, you still receive alerts for any metrics that you follow. For information about setting your digest preferences, see Manage your Tableau Pulse digest.
Added December 18, 2025
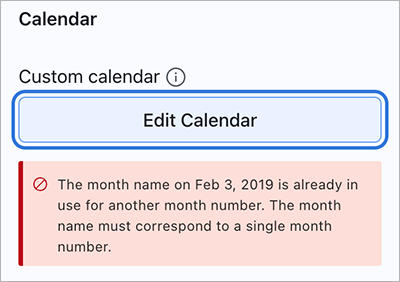
Validate your custom calendar
When you configure a custom calendar as part of a metric definition, Tableau Pulse validates the data to make sure that it’s in the correct format. If your custom calendar doesn’t pass this validation, you see an error message that helps you troubleshoot the calendar. The error displayed is the first error that Tableau Pulse encounters. To understand how Tableau Pulse validates the fields in your custom calendar, see Requirements for custom calendars.
Added November 20, 2025
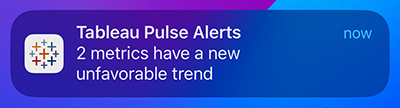
Receive mobile notifications for important changes to your metrics
Tableau Mobile now sends you alerts as push notifications when it detects unfavorable changes to the metrics that you follow. These alerts include when a metric crosses into an unfavorable threshold range and when a new unfavorable trend is detected. Tap on an alert to learn more about these changes to your data.
To receive push notifications, you must turn on notifications for the Tableau app on your device. You receive these notifications even if the Tableau Mobile app is closed, as long as you have notifications turned on. If you have an Android device, when you install the Tableau app, these notifications are turned off by default.
Turn on notifications on Android
- On your Android device, navigate to Settings > Notifications > App notifications.
- From the menu, select All apps.
- Select Tableau.
- Under notification categories, select Show unused categories.
- Select Other.
- Make sure that the Tableau Pulse toggle is on.
Turn on notifications on iOS
- On your iOS device, navigate to Settings > Notifications.
- Select Tableau.
- Make sure that the Allow Notifications toggle is on.
Get insights from enhanced Q&A about goals and thresholds (Tableau+ license edition required)
If a metric has a goal or threshold, enhanced Q&A now has that context and provides you with insights about how the data is performing relative to the goal or threshold. To access enhanced Q&A, select the Ask button on a metric, then select an enhanced Q&A question. Or, from the Tableau Pulse home page, select one of the enhanced Q&A questions for a group of metrics.
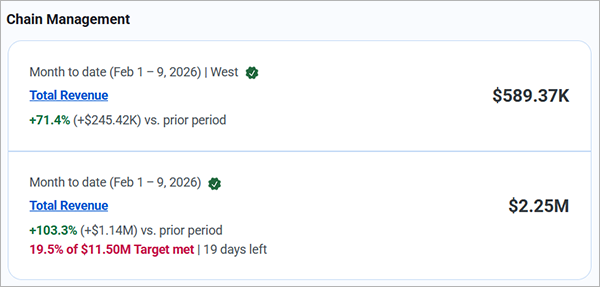
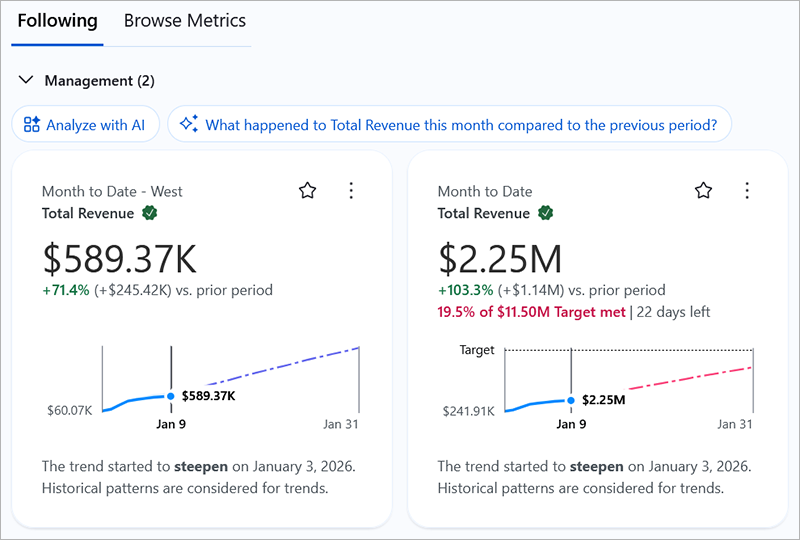
Check goals and thresholds on your Tableau Pulse home page
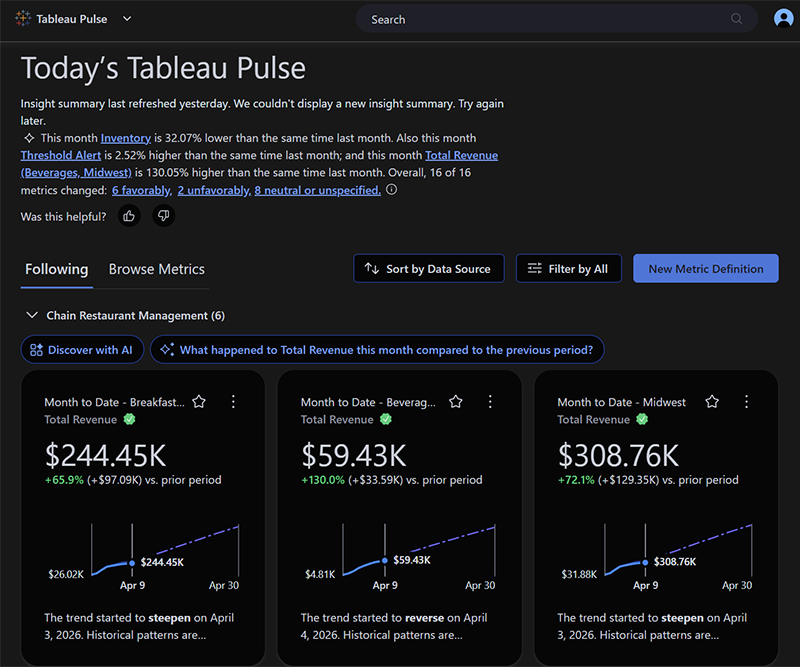
The metric cards shown on the Following tab of the home page now show goal and threshold information. At a glance, you can see how all of your metrics are performing both compared to the prior period and relative to goals or thresholds.
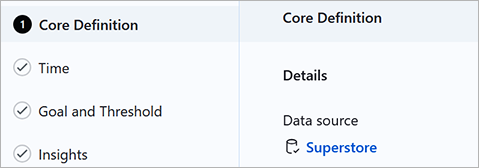
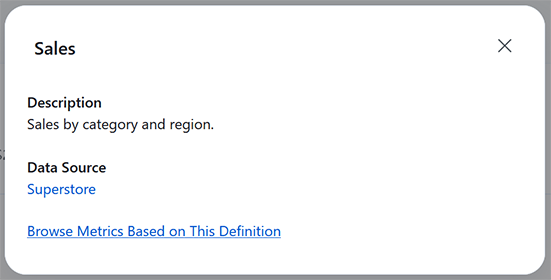
Go to the connected data source for a metric
Metrics and metric definitions now link to the data source that they are connected to, letting you easily open that data source in Tableau Cloud.
-
On a metric definition, go to the core definition step, then select the data source name.
-
On a metric, select the info icon to see the metric metadata, then select the data source name.
Added November 6, 2025
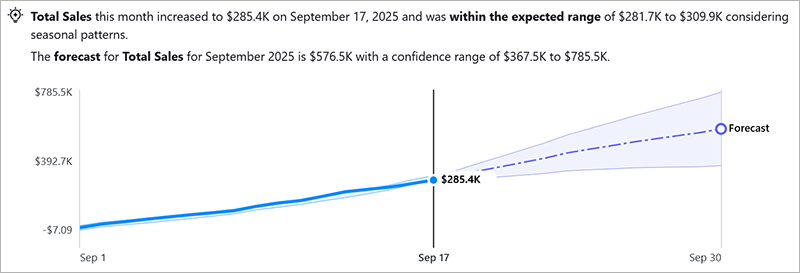
See a descriptive legend on charts
The overview chart for a metric now shows a legend that labels each of the elements on the chart. The legend helps you understand which data on the chart is complete, which is still in progress, and which is a forecast, as well as any goals or thresholds.
Filter data with user functions in advanced definitions
When you create a metric definition using the advanced editor, you can now add user functions that filter the data for specific users or groups. These functions are a useful alternative if you don’t have row-level security on the data source that the metric definition is connected to. For more information about writing user functions, see User Functions.
Added October 23, 2025
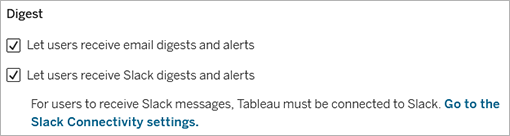
Control the channels where users can receive digests
As a Tableau Cloud administrator, you can now turn off the ability for users to receive Tableau Pulse digests and alerts via email and Slack. When a channel is turned off, a message appears informing users of this in their Tableau Pulse preferences. For more information, see Configure digests.
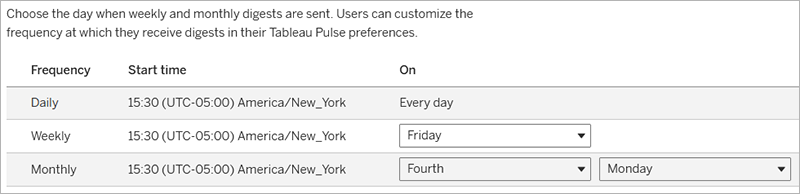
Set the day when digests are generated
As a Tableau Cloud administrator, you can now set the day of the week and the day of the month when weekly and monthly digests are generated. Tableau Pulse begins generating digests at the designated start time on these days. For more information, see Configure digests.
Added October 3, 2025
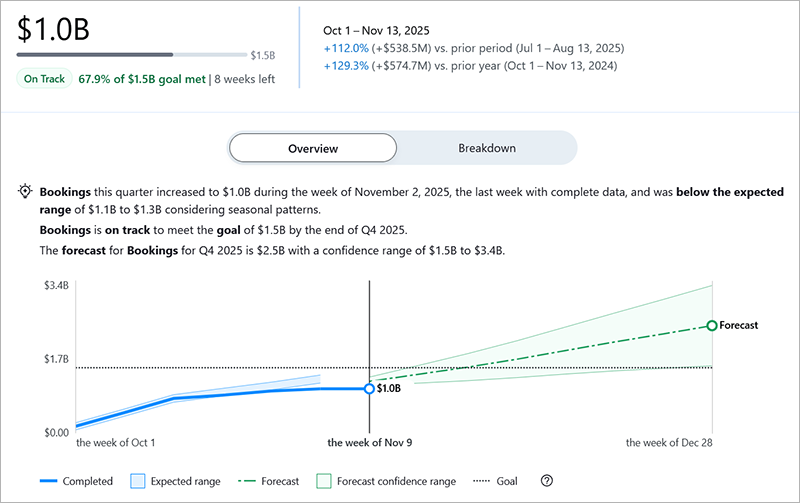
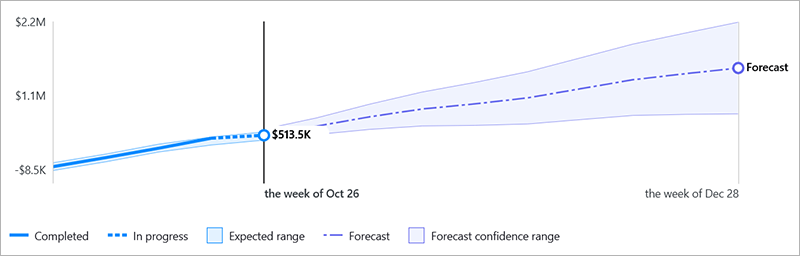
Check the forecast for a metric
The overview chart for a metric now shows a forecast of how the metric is expected to perform for the remainder of the period. Forecasts are available for sites with a Tableau+ license edition and appear only on metrics with period-to-date time ranges. If Tableau Pulse isn’t confident in a forecast, the forecast doesn’t appear on the overview chart, but you can still use the Ask button to see the forecast. If you don’t want a metric to show a forecast, turn off the forecast insight type on the metric definition. For more information about the forecast insight type, see Insight types in Tableau Pulse.
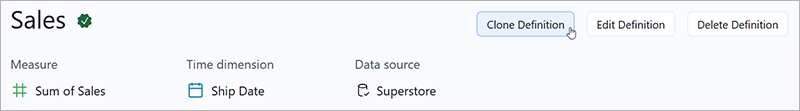
Clone an existing metric definition
Get a head start on creating a metric definition by cloning an existing definition. When you clone a definition, all of the configuration from the original definition carries over except for the governance step. Cloning is particularly useful if you need to set up definitions for different measures from the same data source. To save a cloned definition, you must change one or more of the measure, aggregation, time dimension, or adjustable metric filters so that the cloned definition isn’t identical to the original definition. For more information, see Clone a metric definition.
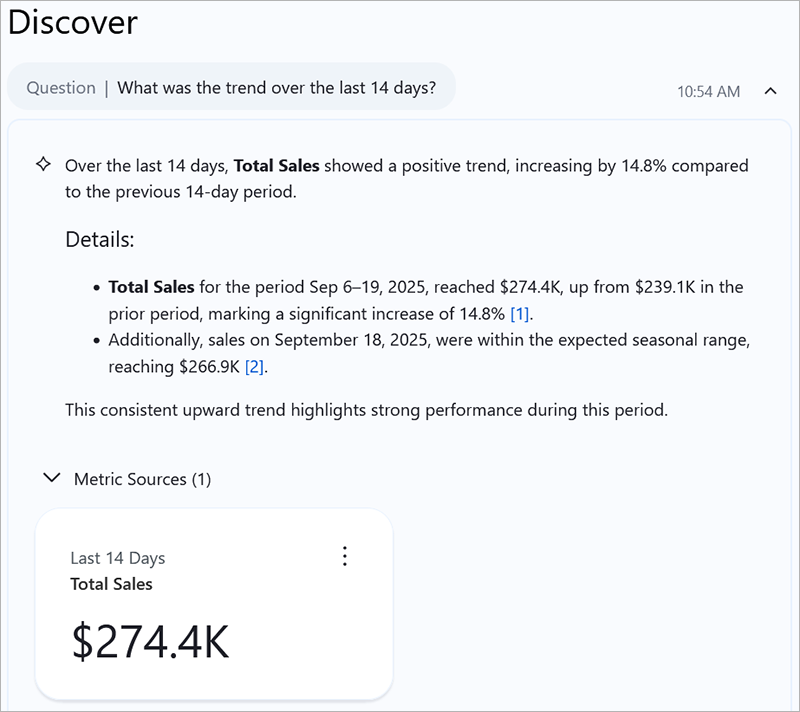
Ask questions about rolling time periods with enhanced Q&A
You can now ask questions about what has happened with your data in the last 7, 14, 30, 60, or 90 days. Enhanced Q&A will provide an answer that analyzes that precise period, using the same rolling date window filter that you can apply to metrics. To access enhanced Q&A, select the Ask button on a metric, then select an enhanced Q&A question. Or, from the Pulse home page, select one of the enhanced Q&A questions for a group of metrics. Enhanced Q&A requires a Tableau+ license edition.
Added September 11, 2025
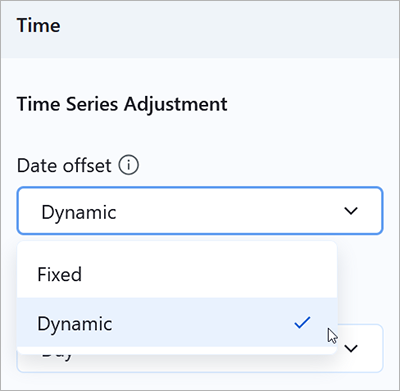
Set a date offset that dynamically adjusts to your data
For metrics that cover a period-to-date time range, the value shown for a metric is for today’s date. If the data source for the metric doesn’t have data for today, then the metric value is null. Set a dynamic date offset on the metric definition so that the metric shows the value for a date in the past instead of null. With a dynamic offset, Tableau Pulse adjusts the time series for a metric to end with the most recent date that has data. For more information, see Set a date offset.
Easier to read Discover briefs
Enhanced Q&A (Discover) now uses intelligent markdown formatting to generate easy-to-read insight briefs. AI-generated insight briefs are automatically structured with headings, bullet points, and summaries, making it easier for you to scan and understand your insights quickly.
Note: Custom formatting controls are not currently supported for insight briefs in Discover.
Added August 28, 2025
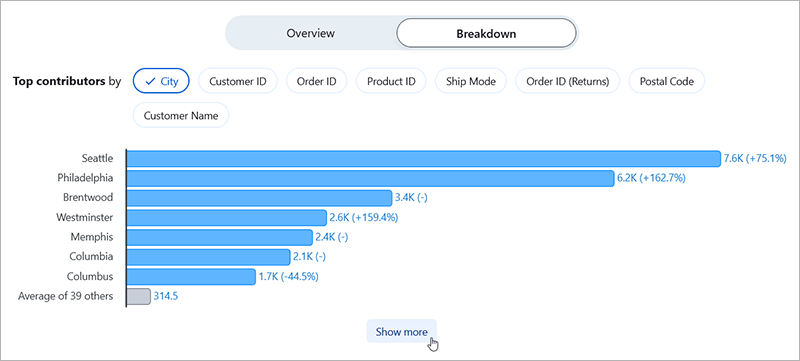
Show more contributors on the breakdown chart
Curious about how different dimension members are contributing to a metric? Select Show more to list more contributors on the breakdown chart. The breakdown chart shows 7 contributors to begin with, and 7 more are shown each time you select show more, up to 50 contributors total.
Set a metric’s time range to a rolling time window
A rolling window shows the most recent 7, 14, 30, 60, or 90 days of data. You can also select a window that shows the data for 1 year in months, and that window ends with the most recent complete month. The comparison period for these metrics follows the same rolling window.
To adjust the time range, select the Filter option on a metric. When you set this filter, you create a new metric if one with those filters doesn’t already exist. Be sure to follow the filtered metric to keep track of it. Followers don’t carry over from the previous metric.
Use generative AI to ask questions when exploring a metric (Tableau+)
For any metric, you can click Ask to ask questions using semantic search or go deep with generative AI. In the same interface, use Ask Q&A to find trusted insights quickly, or use Enhanced Q&A (Discover) for a more conversational, LLM-guided exploration in the same context.
From any metric detail page in Tableau Pulse, under Discover Top Insights, click the Ask button. Enter a question in the first search bar to run semantic search on detected insights. From the search results, click a question with the sparkle icon to use enhanced Q&A with LLM-guided exploration. In the Discover page that opens, ask follow-up questions about the same metric or related metrics you follow, all in the same conversational flow.
You can ask questions about metrics that share the same data source. Response from the LLM responses may vary based on available data and insight coverage. Available in Tableau+ only.
Geo-aware LLM request routing now supported in Enhanced Q&A (Discover) experience and insight summaries
Tableau Pulse Enhanced Q&A (Discover) now supports geo-aware LLM routing through the Einstein GPT Gateway using Azure Open AI. (Tableau+ or Einstein 1 is required.) LLM requests are routed to the nearest supported region based on your Salesforce org, which improves latency and supports data residency requirements. Discover requests are made using your Salesforce org ID, which allows masking and routing controls when the necessary entitlement is used. Insight summaries in Tableau Pulse, which use Tableau-managed org IDs, also support geo-aware LLM queries.
No manual setup or region selection is required beyond the necessary entitlements. Masking can be controlled when tied to a paid entitlement.
If your nearest region is unavailable or overloaded, traffic automatically falls back to the Azure OpenAI location in the US. Fallback from any Azure OpenAI region always routes to the US Azure OpenAI region, never to OpenAI directly. For more information, see Geo-Aware LLM Request Routing on the Einstein Generative AI Platform(Link opens in a new window).
The fallback setting can't be disabled. Only Tableau+ customers have audit log access to see when fallback occurs, and can get the fallback event data from audit logs.
Added August 14, 2025
See how related metrics are similar or dissimilar with the Correlated Metric insight
Correlated Metrics is a new insight type that can answer questions such as "How is Customer Satisfaction related to Wait Time?" Tableau Pulse can now show how a metric is similar or dissimilar to another metric that has been flagged as a candidate for consideration.
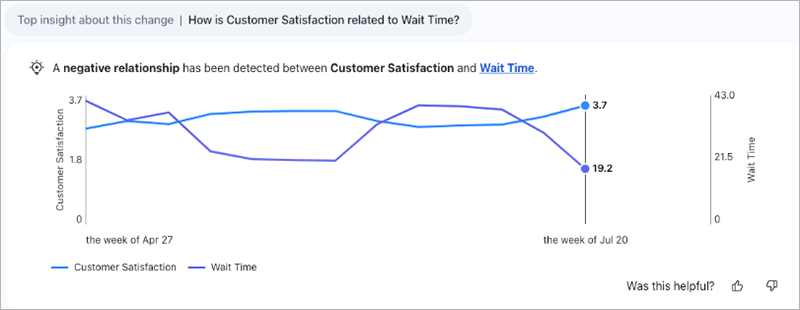
When editing a metric definition, you can choose up to five candidates for Tableau Pulse to consider for correlation to the metric. These candidates are metric definitions that you consider to be related to the metric and that are expected to move in similar or strongly dissimilar ways.
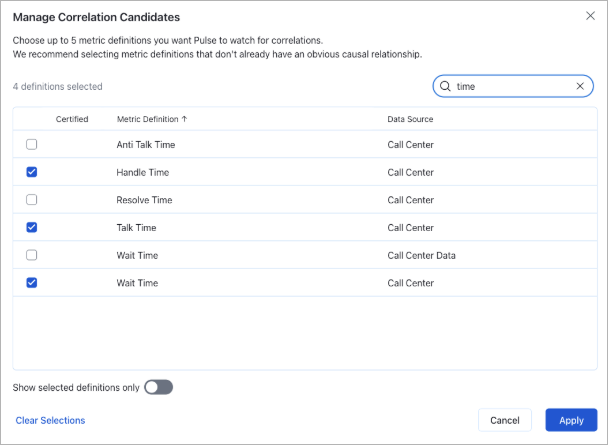
For more information on setting up Correlated Metrics, see Configure insights(Link opens in a new window).
Catch up with Tableau Pulse insights and alerts in the Tableau App for Microsoft Teams
More Tableau Pulse features are now available in the Tableau App.
- Insight summary: Check the insight summary on the Tableau Pulse home to get an overview of important changes to your data.
- Alerts: See alerts for unfavorable changes to the metrics that you follow.
- Metric insights in your preferred language: The insights shown for individual metrics automatically reflect the language that is set for Microsoft Teams. Note that the insight summary uses the language that is set for the Tableau app, which is a separate setting from the Microsoft Teams language setting.
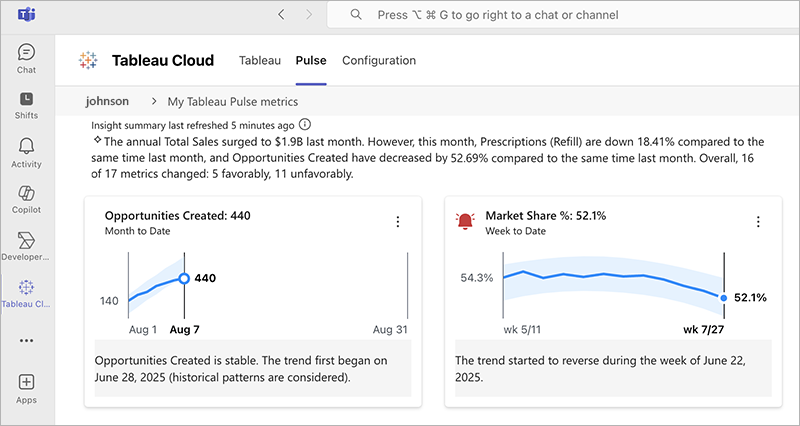
For information about the Tableau App for Microsoft Teams, see Setup Guide: Tableau App for Microsoft Teams.
Added August 7, 2025
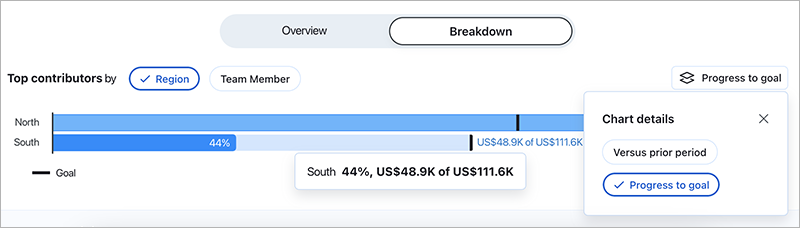
Show goals or thresholds on the metric breakdown chart
On the Breakdown tab for a metric, you can change the chart details to show goal or threshold data. This option appears only if there's a data source goal or threshold set on the definition for a metric. You can turn off this option by adjusting the Goal and Threshold Breakdown insight on the insight settings for a metric definition. For information about adjusting insights, see Configure insights. For information about metric details, see Explore metrics in detail, adjust the time range, or apply filters.
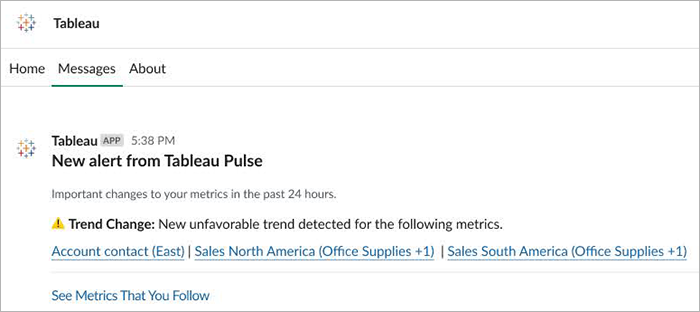
Get off-cycle Slack alerts
If you aren’t scheduled to receive a Slack digest on a day that Tableau Pulse identifies an alert, you now receive a Slack message with that alert. Tableau Pulse checks the metrics that you follow every 24 hours to see if they have crossed into an unfavorable threshold range or if there's a new unfavorable trend for the data. On days when you do receive a Slack digest, the alert appears at the top of the digest rather than as a separate message. For information about alerts, see Get Tableau Pulse Alerts.
Added July 24, 2025
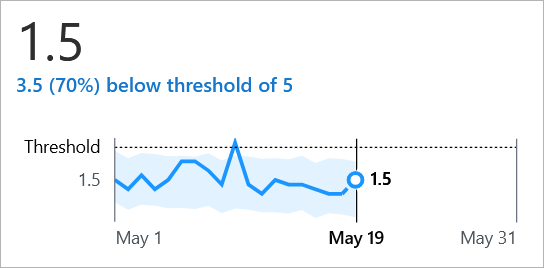
Get threshold alerts
When a metric that you’re following crosses into an unfavorable threshold range, you get notified in email, Slack, and Tableau Mobile, and an alert appears on the Tableau Pulse site. For more information, see Get Tableau Pulse Alerts.
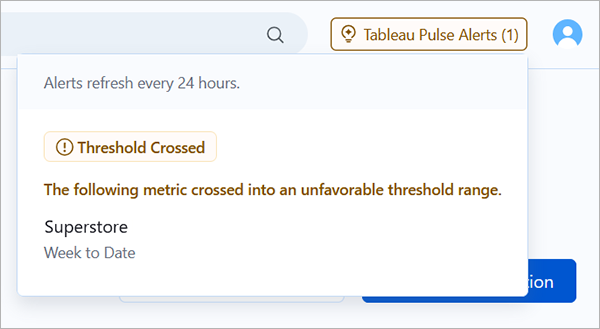
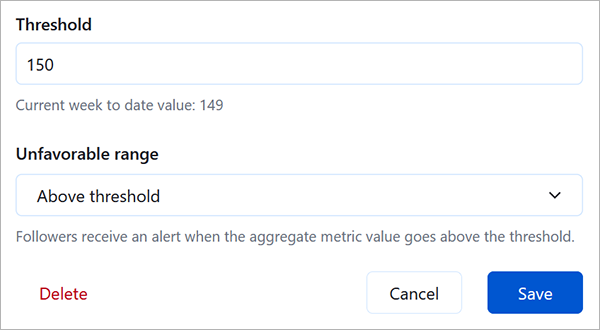
Set an unfavorable threshold range
Define whether a metric should stay above or below a threshold. You can set an unfavorable range for both data source thresholds and manual thresholds. When the aggregate value for a metric crosses into the unfavorable range, Tableau Pulse generates a threshold alert. For more information, see Configure data source goals and thresholds and Create a manual goal or threshold.
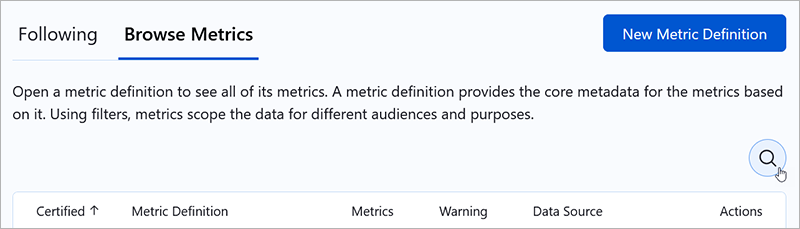
Search and sort metric definitions
On the Browse Metrics tab, select the search icon to search the list of metric definitions. Select the Certified, Metric Definition, or Metrics column headers to sort by those columns.
Added July 10, 2025
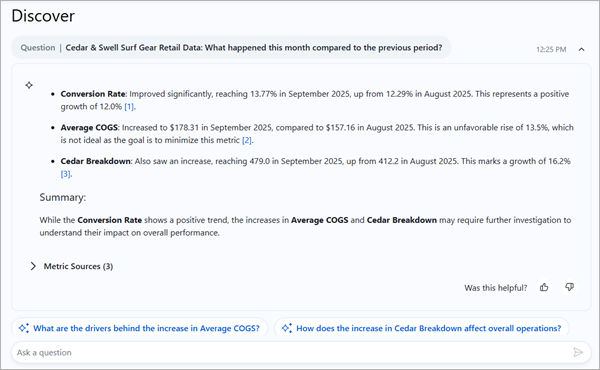
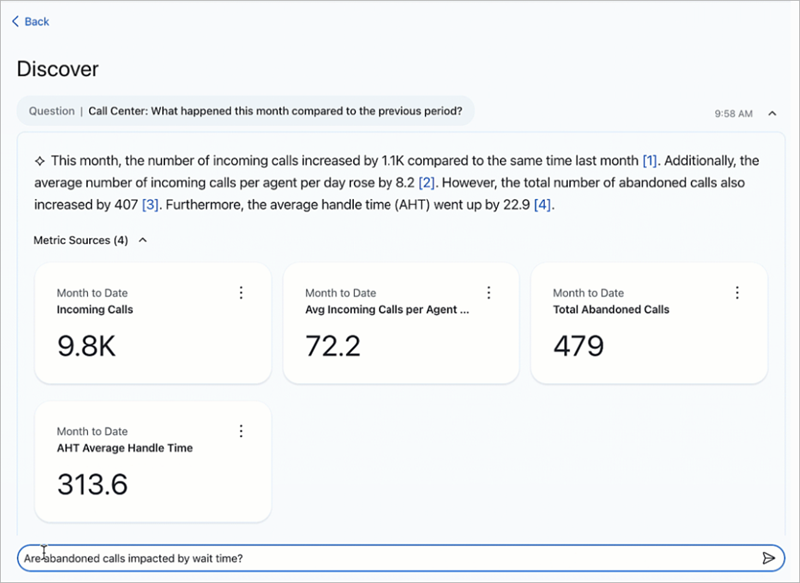
Discover insights across multiple metrics with cross-metric analysis
Enhanced Q&A (Discover) now supports cross-metric analysis, allowing you to compare metrics side-by-side and surface meaningful patterns. It can highlight shared contributors, detect when trends move together or in opposite directions, flag entities that are outliers across multiple metrics, and identify metrics that are jointly above or below expected ranges, all in a single, natural-language response. For more information, Ask Questions and Discover Insights in Tableau Pulse(Link opens in a new window).
Added June 5, 2025
Stay informed with off-cycle alert emails
Tableau Pulse now sends an email if it identifies alerts on a day that you aren’t scheduled to receive a digest. Previously, alerts were sent only as part of digests. If your digest frequency was set to weekly or monthly, you didn’t get email notifications about alerts found on days without a digest. For more information about alerts, see Get Tableau Pulse Alerts.
Added May 22, 2025
Set thresholds for metrics
Measure how a metric is performing relative to a threshold value by setting a data source or manual threshold. Data source thresholds are dynamic values that you set on a metric definition. Manual thresholds are a single static value that you set on an individual metric. Anyone who views a metric sees the threshold value. For more information, see Configure data source goals and thresholds and Set Manual Goals and Thresholds with Tableau Pulse.
Added May 7, 2025
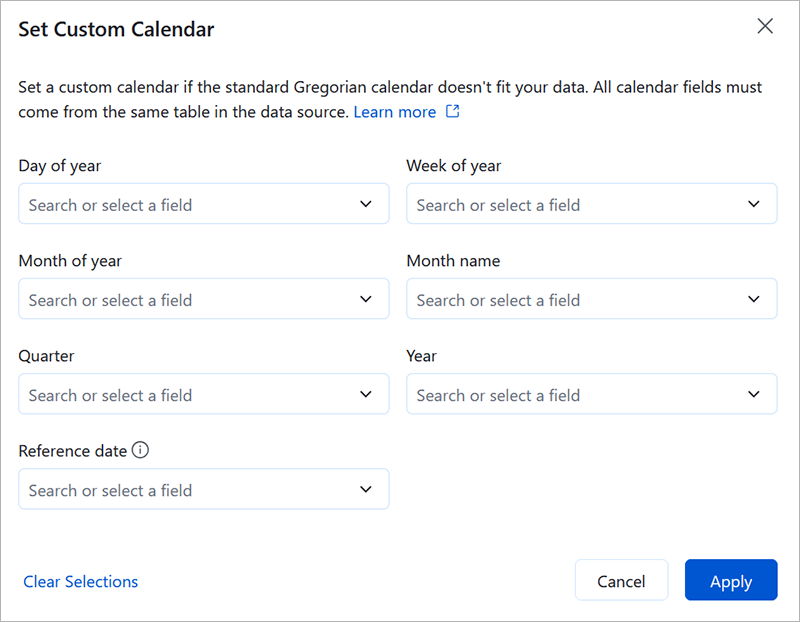
Set a custom calendar
If the standard Gregorian calendar doesn't fit your organization's data, set a custom calendar. You now have the flexibility to configure calendars such as a 4-5-4 retail calendar. Tableau Pulse aggregates metric data for different time ranges and comparison periods based on the custom calendar. For more information, see Set a custom calendar.
Ask questions based on dimension members in Enhanced Q&A (Discover)
Let your users follow their curiosity freely—exploring different regions, segments, or time periods—all through natural language in Enhanced Q&A (Discover). Discover can now handle questions that filter metrics based on dimension values (region, product, segment) or compare dimension members (West versus East) to uncover meaningful patterns.
For example, you could ask "Show sales for California" or "Compare APAC vs. EMEA" to automatically expand your exploration to the full set of compatible metrics. For more information, see Ask Questions and Discover Insights in Tableau Pulse.
Ask questions and get responses in your preferred language with Enhanced Q&A (Discover)
Enhanced Q&A (Discover) now supports multilingual questions and responses, aligned with Tableau Cloud supported languages. Suggested questions, follow-up questions, and insight briefs adapt to the site’s language setting. Discover detects your input language as you ask questions and it returns LLM responses in that language—even if it differs from the site or data language. Metric names and filters always remain in their original, authored language for clarity and consistency. For more information, see Multilingual support for questions and responses in Tableau Agent in Pulse.
Added April 24, 2025
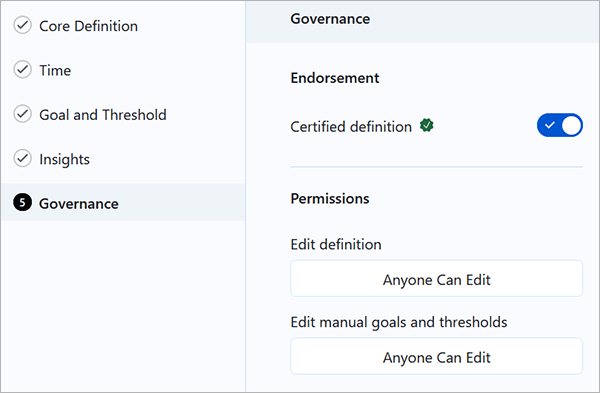
Certify metric definitions
Tell others that a metric definition is trusted and recommended by certifying it. A certified badge appears on metrics that are based on certified definitions. That badge helps users feel confident relying on those metrics to make business decisions.
You certify a metric definition on the new governance step that is part of editing or creating definitions. The existing permission settings for metric definitions have also moved to the governance step. For more information, see Configure governance.
Added April 10, 2025
Customize the metrics in your insights summary
When you follow a metric, notable changes about that metric can appear in the insights summary at the top of your Tableau Pulse home page and in your Slack and email digests. You can now further customize these summaries by muting metrics. When you mute a metric, insights about that specific metric are removed from your summary without unfollowing the metric. For more information, see Customize your home page and digests.
Added March 27, 2025
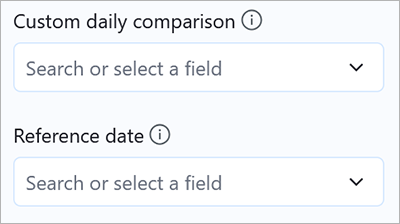
Set a custom comparison date for metrics
For metrics filtered to Today or Yesterday, a custom comparison overrides the comparison to the prior day or the same day from a year ago. This comparison option allows you to compare data for events that don’t fall on the same date each year. For more information, see Set a custom daily comparison.
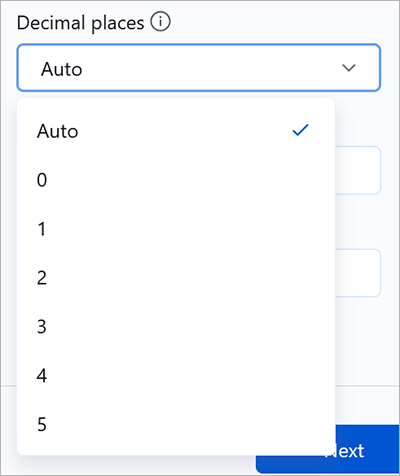
Choose the number of decimal places for metric values
If your data needs to be formatted with a consistent number of decimal places, you can choose the precise number, from 0 to 5. By default, Tableau Pulse automatically determines the number of decimal places to show, with larger values showing fewer decimal places. For more information, see Define metric options.
Discover more insights with enhanced Q&A (Tableau+)
Enhanced Q&A (Discover) makes it easier to explore insights across groups of business-critical metrics, and then dig deeper on the Discover page. When metrics in Tableau Pulse are grouped by data source, definition, or time range, Discover uses statistical algorithms to examine grouped metrics and surface insights that are relevant, interesting, and worth investigating.
The enhanced Q&A experience provides intuitive key insights, relevant visualizations, source references, and suggested follow-up questions to help you dig deeper. Because it is powered by AI in Tableau, you can ask questions in your own words to get relevant, natural language answers about your data.
Enhanced Q&A (Discover) is available as a Tableau+ premium feature in Tableau Pulse on both web and mobile. Enhanced Q&A (Discover) must be turned on in Tableau Cloud site settings, and requires a connection to a Salesforce org that has Einstein generative AI set up for the selected Salesforce org. For more information, Ask Questions and Discover Insights in Tableau Pulse(Link opens in a new window) and Turn on Tableau Agent in Pulse(Link opens in a new window).
Better semantic matches in any language for Ask Q&A
Turning on this setting enhances semantic matching for any language when you use Ask Q&A. When this setting is on, questions and insights text are sent to OpenAI as part of semantic matching. All calls to OpenAI go through the Einstein Trust Layer(Link opens in a new window). For more information, see Turn on better semantic matches for Ask Q&A in Tableau(Link opens in a new window)
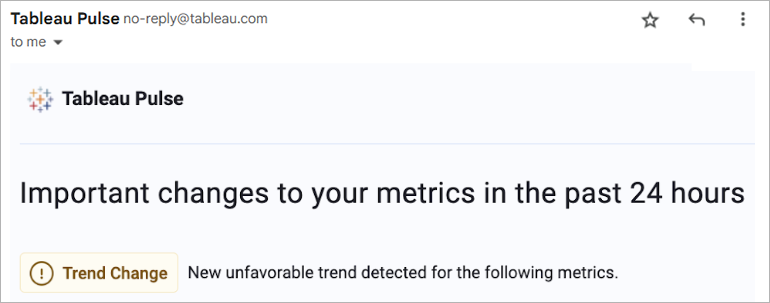
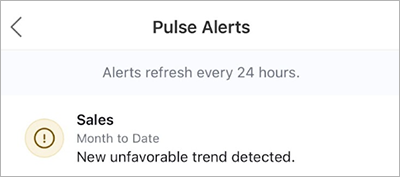
Get alerts for new unfavorable trends
If Tableau Pulse detects a new unfavorable trend in the data for a metric that you follow, you receive an alert about that trend in your email and Slack digests. If you use Tableau Mobile, you also receive a notification on your mobile device. For more information, see Get Tableau Pulse Alerts.
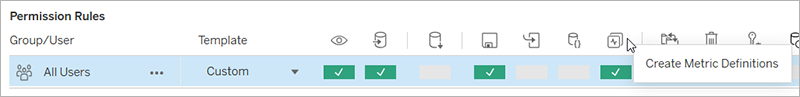
Control who can create metric definitions from a data source
Data sources have a new Create Metric Definitions permission capability. With this capability, you can now separately control who can create metric definitions from a data source and who can view metrics that use that data source. For more information, see Permissions for creating metric definitions.
Adjust when Tableau Pulse starts generating digests
Tableau site administrators can set the time at which Tableau Pulse starts generating email and Slack digests. That way, if your data refreshes at a specific time, the digests reflect the freshest data. For more information, see Configure digests.
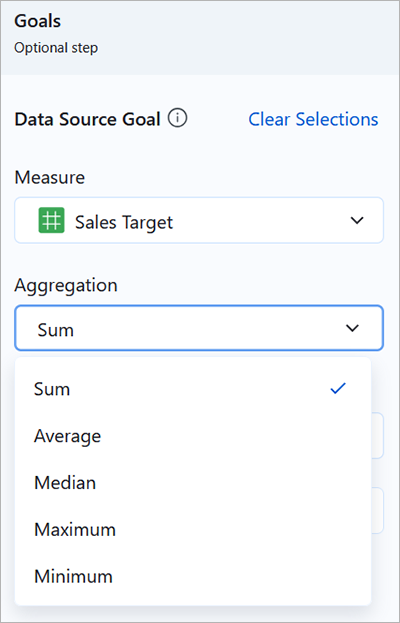
Set the aggregation type for data source goals
You can now choose how Tableau Pulse aggregates the data for a data source goal. Measures can be aggregated as a sum, average, median, maximum, or minimum, and dimensions can be aggregated as a count or distinct count to produce a measure. Previously, all data source goals were aggregated as a sum. Additionally, you can now set data source goals for metric definitions that use any aggregation. Previously, you could create data source goals only for metric definitions where the measure was aggregated as a sum or count. For more information, see Configure data source goals and thresholds.
Create an advanced data source goal
The advanced editor lets you create data source goals using the familiar Tableau viz authoring environment. You can use the advanced editor to create goals based on calculated fields. For more information, see Configure data source goals and thresholds.
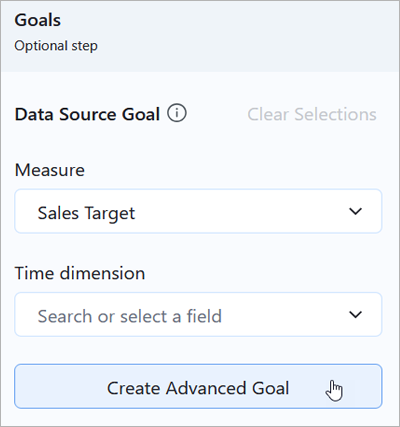
Tableau Pulse data source goals
When creating or editing a metric definition, you can set a goal that uses a field from your data source to specify the goal values. This goal appears on the metrics based on the definition and is summed based on a metric’s time range. For more information, see Configure data source goals and thresholds and Requirements for data source goals and thresholds.
Tableau Pulse available in 14 languages
Tableau Pulse now reflects the language and locale set by the user on Tableau Cloud and the language set for the device on Tableau Mobile. Tableau supports English (US), English (UK), French (France), French (Canada), German, Italian, Spanish, Brazilian Portuguese, Swedish, Japanese, Korean, Traditional Chinese, Simplified Chinese, and Thai. For more information, see Technical Specifications for Tableau Cloud.
Tableau Pulse links to related content
When creating or editing a metric definition, you can add links to related content. These links appear on each metric’s Insights Exploration page. Consider including links to related dashboards, Slack channels, or workflows to help others follow up on the data. For more information, see Configure the core definition.
Tableau Pulse new border style for dashboard object
When embedding a metric in a dashboard, you can select the Tableau Pulse style option so that the dashboard object resembles the rounded-corner metric cards in Tableau Pulse. Without this style option, the metrics on a dashboard resemble other borderless dashboard objects. For more information, see Add metrics to dashboards and create metrics from dashboards.
Turn off the Unexpected Values insight in Tableau Pulse
In metric definition settings (Insights tab), you can turn off the Unexpected Values insight to hide the text description and expected range (blue shaded band in chart). For more information, see Insight types in Tableau Pulse.
Tableau Pulse personalized insight ranking setting
Administrators can turn Tableau Pulse personalized insight ranking off or on in site settings, independent of the setting to deploy Tableau Pulse. For more information, see Turn off Personalized Insight Ranking.
Tableau Pulse currency setting
When you set your definition to use the currency number format, you can now set which nation's currency to use, and Tableau Pulse will display that currency symbol and number format.
Added in August 2024
Tableau Pulse dashboard object
You can now add a Pulse Metric object to your dashboards. When you add this object, you can choose from metrics that connect to the same published data sources that are used by the workbook. For more information, see Add metrics to dashboards and create metrics from dashboards.
Tableau Pulse grouping and sorting
Customize your Tableau Pulse home page and digests by grouping and sorting metrics. You can now sort metrics based on how recently you followed the metric, or group metrics that share a metric definition or a data source. For more information, see Customize your home page and digests.
Tableau Pulse goals
Create a goal in Tableau Pulse to track a metric’s progress toward the goal. After a goal is created, you’ll see your progress toward that goal in your Tableau Pulse digests and on your Tableau Pulse home page. For more information, see Set Manual Goals and Thresholds with Tableau Pulse.
Tableau Pulse improved Ask experience for exploring insights
Ask more questions about a metric to get suggestions for insights based on the same metric definition. You can now enter questions that adjust the time granularity and apply dimensional filters for the current metric view. For example, "Sales in California last week," "Zoom into technology," or "What about yesterday?" For more information, see How Tableau Pulse Approaches NLP with Q&A to Empower Everyone.
Tableau Pulse for Salesforce app
The Pulse for Salesforce app connects your Salesforce org with Tableau, creates metrics based on your Salesforce data, and surfaces these metrics in Salesforce. For more information, see Set Up the Pulse for Salesforce App.
Tableau Pulse minimum time granularity
You can now set a minimum time granularity for a metric definition, which limits the time ranges that users can select when filtering to create metrics. This prevents users from selecting time ranges that would result in an empty chart because data doesn’t exist for that granularity. For more information, see Define the metric value.
Tableau Pulse week start based on data source
If the data source that a metric connects to has a different week start than the default (Sunday), the metric reflects that start day. That day appears as the first day of the week for metric charts and insights that deal with weekly values.
Tableau Pulse restrict metric definition editing
You can restrict who can edit or delete a metric definition so that only specific users and groups have access. For more information, see Restrict editing for definitions and manual goals and thresholds.
Tableau Pulse record-level outliers insight type
A new insight type, record-level outliers, is now available to help you easily spot outliers in your data that are impacting metric values. This insight type shows notably high or low values for a metric, in the context of row-level values of the metric across a period of time. For more information, see Insight types in Tableau Pulse.
Tableau Pulse outlier insight setting
Turn on or off the record-level outliers insight type to control whether Tableau Pulse looks for extremely high or low values in your data. For more information, see Configure insights.
Tableau Pulse date offsets
You can now add a date offset to your metric definition to change the final point in the time series from “Today” to a set number of days in the past. For more information, see Define the metric value.
Tableau Pulse adjustable metric filter improvements
The metric filter options that you can select now show only relevant values when definition filters have been applied to a metric definition. This means that if a metric definition has a definition filter set to limit the data to a certain region, for example, only cities in that region will appear as options for adjustable metric filters.
Tableau Pulse personalized insight ranking
Enhance your insights experience by letting Tableau Pulse know which insights you find most valuable. Your thumbs-up and thumbs-down feedback on insights influence which insights you see first.
Tableau Pulse charts in Slack
When you check your Tableau Pulse digest in Slack, you'll now see a sparkline chart that shows that period's data.
Tableau Pulse improved metric recommendations for dashboards
When you explore recommended metrics for dashboards, Tableau now shows more relevant and informative recommendations. Additionally, calculated fields from the data source now appear in recommendations.
Tableau Pulse pre-aggregated fields in metric definitions
When creating a definition, you can now select a field that is pre-aggregated in the data source and use it as the measure.
Tableau Pulse applied filters shown for metrics
When you visit the Insights Exploration page for a metric, the specific filters that are applied to that metric are now listed above the chart.
Tableau Pulse improved navigation options
The Tableau Pulse sparkle (upper-left corner of the Insights Exploration page) now includes drop-down options for navigating to the Tableau Cloud home page and followed metrics.
Tableau Pulse ad-hoc questions for insights
In the guided insights experience, click the Ask button and enter your own questions related to the insights surfaced for a metric. Receive semantically matched suggestions for more insights. For more information, see How Tableau Pulse Approaches NLP with Q&A to Empower Everyone.
Tableau Pulse follow metrics
Adjust filter values and follow different metrics based on the same definition. When you follow a metric, the time period and filter selections are preserved in your Tableau Pulse home page and digests. For more information, see Follow metrics.
Tableau Pulse guided insights
Tableau Pulse provides a path for exploring your data by surfacing questions for each insight that it detects for a metric. As you click through the suggested questions about your data, answers are revealed in easy-to-read charts with insights about the underlying data. For more information, see Explore metrics in detail, adjust the time range, or apply filters.
Tableau Pulse insights platform
The insights platform automatically detects drivers, trends, contributors, and outliers for metrics. It proactively flags and describes insights that matter using natural language and visual explanations. For more information, see The Insights Platform and Insight Types in Tableau Pulse.
Tableau Pulse insight summaries
Tableau Pulse looks across the metrics that you follow and leverages AI in Tableau to summarize the most important insights. Insight summaries make use of a large language model (LLM) to provide a personalized overview in plain language. AI in Tableau is built on the Einstein Trust Layer, meaning it enables trusted, ethical, and open AI-powered experiences without compromising data security and privacy. For more information, see Insight summaries highlight metrics of interest.
Tableau Pulse metrics layer
The metrics layer provides a single source of truth for your data. Create metric definitions to specify the core metadata that metrics are based on, then adjust filters and time options to create metrics for different groups of followers. For more information, see Create Metrics with Tableau Pulse.
Tableau Pulse recommended metrics for dashboards
Get a head start on creating metrics by selecting the recommended metrics displayed for Tableau dashboards. For more information, see Add metrics to dashboards and create metrics from dashboards.
Tableau Pulse deployment setting
Choose to deploy Tableau Pulse for a single group of users or for all users on your Tableau site. For more information, see Deploy Tableau Pulse for your site.
Tableau Pulse insight summaries setting
Insight summaries can be turned on or off independently of the site setting used to deploy Tableau Pulse. For more information, see AI in Tableau for Tableau Pulse.
Tableau Pulse fiscal calendar support
Tableau Pulse now reflects fiscal calendars that have been set on a data source or on specific fields in a data source. For more information, see How fiscal calendars work with metrics .
Tableau Pulse admin insights
Tableau Puse metadata has been added to the Site Content, Users, and Subscriptions data sources for Admin Insights. Admins can use these data sources to learn about the definitions and metrics on a site. For more information, see Use Admin Insights to Create Custom Views.
Tableau Pulse primary time comparison
You can now set a primary time comparison as part of a metric definition, and all metrics based on the definition will use that comparison in digests and insights. For more information, see Define the metric value.