Ask Questions and Discover Insights in Tableau Pulse
Tableau Pulse helps you investigate your data by surfacing insights and suggesting questions for further exploration. As you click through the questions about your data, answers are revealed in charts with insights about the underlying data. There are two ways to explore insights: Ask Q&A and Tableau Agent in Pulse.
Ask Q&A suggests questions for pre-detected insights for a single metric. Ask Q&A is always available and doesn't use AI in Tableau.
Tableau Agent in Pulse is a conversational AI that helps you explore groups of metrics. Ask a question in your own words, and Tableau Agent in Pulse uses statistical algorithms to examine grouped metrics and surface insights that are interesting and worth investigating. Because Tableau Agent in Pulse looks across grouped metrics, it can reveal insights that you might miss if you explored only a single metric.
What is Tableau Agent in Pulse?
Note: Enhanced Q&A (Discover) has been renamed to Tableau Agent in Pulse. The functionality remains the same. Only the name has changed. You'll see the name change in upcoming releases.
Tableau Agent in Pulse is an AI-powered tool that helps you explore insights across groups of metrics.
-
It's a conversational way to investigate your metrics. Your first question is just the start. Dig deeper by asking about different dimensions and time periods for additional insights.
-
It's for everyone, no matter your experience level. You don't need data visualization expertise to get actionable insights. Use natural language to understand what's driving changes to your metrics.
-
It's there to guide you in your exploration. If you aren't sure what to ask, Tableau Agent in Pulse provides suggested initial and follow-up questions.
-
It's scoped to metrics in Tableau Pulse. Tableau Agent in Pulse is a specialized AI that helps you understand your metrics but isn’t intended for general Q&A.
-
It's rooted in trusted insights. Each answer is backed up by citations that are based on your metrics. Those citations are illustrated by visualizations that help you understand that data at a glance.
-
It's informed about groups of metrics. Tableau Agent in Pulse has a wider lens on your data than individual metrics. When you ask about a broader set of metrics, Tableau Agent in Pulse looks across grouped metrics to uncover insights that you wouldn't see if you looked at a single metric in isolation.
Explore groups of metrics with Tableau Agent in Pulse
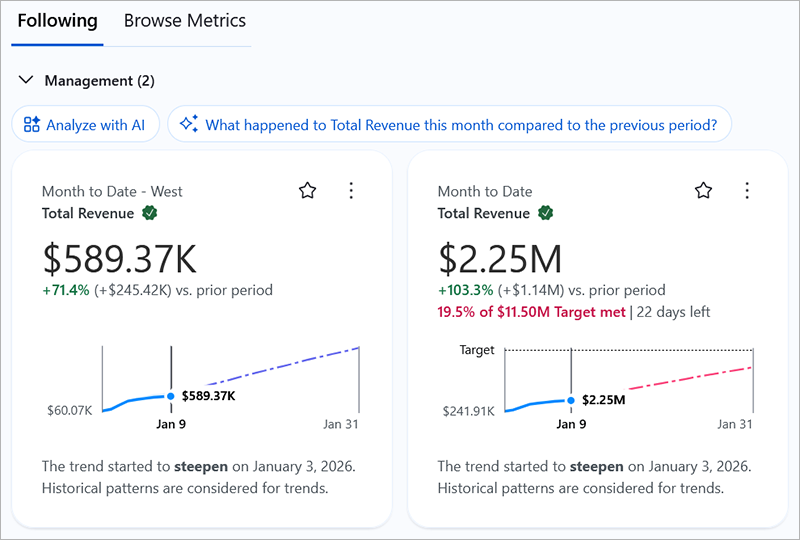
When Tableau Agent in Pulse is turned on, it's surfaced on the Tableau Pulse home page. For metrics that are sorted by data source or definition, the Ask Tableau Agent in Pulse button appears. When you ask a question with this button, Tableau Pulse looks across all of the metrics in the group to find insights. For metrics sorted by data source, definition, or time range, there are suggested questions for you to explore. These questions look across a sub-set of metrics in the group. Tableau Agent in Pulse highlights shared contributors, detects when trends move together or in opposite directions, flags outliers across metrics, and identifies metrics that are jointly above or below expected ranges.
Important: Tableau Agent in Pulse is a Tableau+ feature that must be turned on in the Tableau Cloud site settings. For more information, see Turn on Tableau Agent in Pulse. If your site doesn’t have a Tableau+ license edition, you can try Tableau Agent in Pulse with Try AI. For more information, see Try Tableau Agent in Pulse.
Ask questions with Tableau Agent in Pulse
To start using Tableau Agent in Pulse, ask a question about the metrics on your Following tab.
-
On the Tableau Pulse home page, under a group of metrics, select Ask Tableau Agent in Pulse. This button appears only if you have your metrics sorted by data source or metric definition. If you aren’t sure what to ask, you can select one of the suggested questions.
-
In the text box that appears, enter a question about your data. For examples of questions that you can ask, see Example questions for Tableau Agent in Pulse.
-
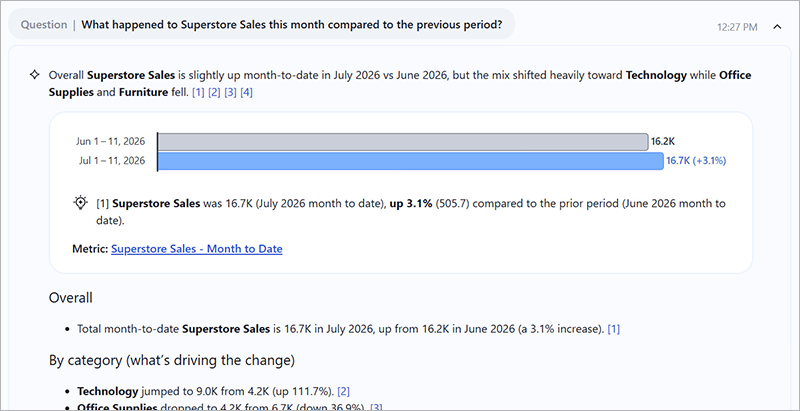
On the Tableau Agent in Pulse page, an insight brief answers the question. Click a citation link at the end of an insight to see its source. Click Metric Sources to see metrics considered as part of the analysis when the response is generated.
-
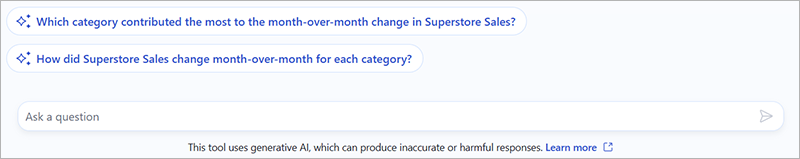
Select other questions at the bottom of the insight brief to explore more insights, or enter a question in your own words in the text box located near the bottom of the Tableau Agent in Pulse page.
Example questions for Tableau Agent in Pulse
Use these questions as inspiration to guide your conversation with Tableau Agent in Pulse.
| Insight Type | Example Question |
|---|---|
| Period Over Period Change | What happened to admission rates in the last 30 days? |
| Correlated Metrics | How are revenue and deliveries relating to each other in the last 90 days? |
| Record-level Outliers | Which transactions are outliers? |
| Current Trend | What's the trend for call time this week? |
| Unexpected Values | Is CSAT lower than expected? |
| Goal and Threshold Breakdown | Are refunds in the southwest below the threshold? |
| Pace to Goal | How are we trending towards our donation target for this month? |
| Top Drivers | Which product lines are driving revenue growth? |
| Top Detractors | Which product lines detracted the most from revenue? |
| Concentrated Contribution Alert | Are there any risky monopoly scenarios? |
| Top Contributors | Which account executives contributed the most to sales this quarter? |
| Bottom Contributors | Which menu items contributed the least to profit this year? |
| Cross-Metric Analysis | What's up with churn rate and new applications? |
Limit the scope of your conversation for better answers
Large language models have a set amount of information that they can process, known as their context window. The breadth of the metrics and data that you ask about, the length of your conversation, and the complexity of your questions all add to the context that the large language model processes to answer your questions. Too much information can overload the context window and lead to unsatisfactory responses. Optimize the information that Tableau Agent in Pulse processes by following these tips for your conversation.
- Limit the number of metrics in the group that you're asking about by being selective in the metrics that you follow. Tableau Agent in Pulse looks at all of the metrics that you follow for a definition or data source group.
- Be careful asking about dimensions that have a large number of unique values, such as ID numbers for customers or accounts. Instead, scope your question by asking about categories, such as segment or business area.
- Start a new conversation if you’re changing topics to keep the conversation history manageable.
How to set up Tableau Agent in Pulse
Tableau Agent in Pulse requires a Salesforce org to be connected to Tableau Cloud. The connection settings are listed at the beginning of the AI in Tableau section of General settings in Tableau Cloud. Also, Einstein generative AI in Salesforce must be set up for the selected Salesforce org.
To make Tableau Agent in Pulse available in Tableau Cloud, your Tableau Cloud admin must make configuration changes in both Salesforce and your Tableau Cloud site. The complete instructions are described in the help topic Configure Tableau Cloud sites for AI(Link opens in a new window).
The trial of Tableau Agent in Pulse doesn't require a dedicated Salesforce org. For information about how to start the trial, see Start your trial of Tableau Agent in Pulse.
Ideal (and less ideal) data scenarios for Tableau Agent in Pulse
To get the best experience when using Tableau Agent in Pulse, use data that is clean, structured, and validated. Connecting to data that is consistently formatted and accurate produces better metrics and more reliable insights.
Data with the following characteristics provides the best experience with Tableau Agent in Pulse:
-
Time-series data: Data that evolves over time (for example, sales, traffic, financial metrics).
-
Aggregated metrics: Key business numbers that can be summarized as metrics (for example, total sales, average satisfaction, loan approval counts).
-
Clear dimensions: Data sets with well-defined categories such as region, product, or customer segment.
Data scenarios that provide a less ideal experience include:
-
Highly granular data: Data at the highest level of detail with very fine granularity such as minute-by-minute logs.
-
Single, point-in-time data: Static data sets such as one-time survey results.
-
Unstructured data: Free-form text or multimedia that lacks structure.
Time-based filtering
Tableau Agent in Pulse can handle time-based scope adjustments. For example, you can refine your question to compare data from different time periods, such as asking, "What happened last month compared to this month?" Use questions to adjust the granularity or breadth of the insights you're exploring.
Dimension-based filtering
Tableau Agent in Pulse can handle questions that filter metrics based on dimension values (region, product, segment) or compare dimension members (West versus East) to uncover meaningful patterns.
Tableau Agent in Pulse supports filtering and comparing metrics by dimension members. For example, you could ask "Show sales for California" or "Compare APAC vs. EMEA" to automatically expand your exploration to the full set of compatible metrics.
Note: Questions you ask on the Tableau Agent in Pulse page can only filter or compare metrics that share key traits, like the same time granularity or the same set of dimensions. If a metric doesn’t match, it won’t be included in the answer.
Cross-check insight sources for transparency
When using Tableau Agent in Pulse, you can cross-check the insights it generates by clicking the link at the end of each insight. These links cite the metric source and display the insight chart when available. You can use this information to verify that the insights that Tableau Agent in Pulse provides are grounded using the correct data. Occasionally, a metric source might not be clickable if Tableau Pulse couldn't generate a metric with those specific filters, but the insight is still rooted in your data.
Multilingual support for questions and responses in Tableau Agent in Pulse
Tableau Agent in Pulse supports multilingual questions and responses, aligned with Tableau Cloud supported languages. Suggested questions, follow-up questions, and insight briefs adapt to the site’s language setting. Metric names and filters always remain in their original, authored language for clarity and consistency.
Tableau Agent in Pulse can fluently adapt to the language that you enter as a query. It detects the input language as you ask questions and returns responses in that language—even if it differs from the site or data language.
Note: Einstein Trust Layer masking supports 6 core languages; others may reduce response quality. Metric names stay in original language. Input language detection may vary in unsupported locales.
When the LLM attempts to negotiate differences between language input, it can get confused with certain languages and sometimes blend those languages in its response. With current LLM capabilities, for certain languages such as Chinese, the results may be inconsistent. Specifically, entering questions in traditional Chinese can result in responses that contain simplified Chinese, which can make the response difficult to read.
Limitations of Tableau Agent in Pulse
Tableau Agent in Pulse is limited to working with insights from Tableau Pulse metrics, so it can't generate insights from data outside that framework. It can't answer questions about columns that aren't used in the metrics or metadata about the data source such as "Is this data certified?"
It can filter or compare metrics that share key traits, like the same time granularity or the same set of dimensions. If a metric doesn’t match, it won’t be included in the answer.
While Tableau Agent in Pulse strives to provide accurate and actionable insights, occasional hallucinations (inaccurate or off-topic answers) may occur, especially when you ask questions that create more complex queries. LLMs can hallucinate because they generate responses based on patterns in data and probabilities, not direct access to real-world facts. As a result, generative AI can be prone to creating output that sounds plausible but contains incorrect or irrelevant information.
For more information, see AI in Tableau and Trust(Link opens in a new window) and Reviewing generative AI outputs(Link opens in a new window).
Einstein Trust Layer masking for Tableau Agent in Pulse
The Einstein Trust Layer uses advanced pattern matching and machine learning techniques to detect sensitive data in prompts. Personally Identifiable Information (PII) such as names and email addresses are automatically masked using machine learning. For best results, consider structuring your data with clear entity identifiers and consistent field labels to minimize ambiguity and ensure accurate results when masking is applied.
Ask questions about a single metric with Ask Q&A
Ask Q&A is available for single metric exploration. If you don't see an insight you're looking for, click the Ask button to the left of the available questions, and then enter a new question about the metric. Based on your question, Tableau Pulse will look for and rank semantic matches for insights that it detects for the same metric you're investigating. It then lists a question for each detected insight. The filter settings and data available for the metric affect the insights that Tableau Pulse can detect. For more information, see How Tableau Approaches NLP with Q&A to Empower Everyone(Link opens in a new window).
Ask Q&A can be enhanced by turning on the AI in Tableau setting for better semantic matches in Tableau Cloud site settings. For more information, see Turn on better semantic matches for Ask Q&A in Tableau(Link opens in a new window).
Explore a single metric with Ask
-
On the Tableau Pulse home page, click a metric of interest.
-
On the metric page, under Discover Top Insights (following the chart visualization), click a suggested question.
-
To ask your own question, click the Ask button.
-
Enter your question about the metric.
Try asking questions about trends, changes, outliers, or categories that might be contributing to the metric. You can also ask questions that adjust the time granularity and apply dimensional filters for the current metric. For example, you could enter "Sales in California last week," "Zoom into technology," or "What about yesterday?"
-
Based on semantic matching and ranking, Pulse lists questions for each detected insight. Click a question to see the insight. If Pulse can't find a match, it might suggest other questions of interest.