Explore Metrics with Tableau Pulse
Tableau Pulse allows you to make data-driven decisions right in your flow of work by sending you insights about metrics that you follow. For example, if you regularly report on a metric, Tableau Pulse can send you insights about important changes to your data. With Tableau Pulse, users who have Creator, Site Administrator Explorer, or Explorer (can publish) site roles can create a metric definition that provides the metadata for all related metrics. All users can follow and interact with metrics, which use the core definition plus optional filters to scope the data for different audiences and purposes. When you follow a metric, insights about your data are delivered directly where you’re working–in email or Slack.
Each digest includes contextual insights about the metrics you follow, and you can explore individual metrics for further insights. To learn more about AI in Tableau, see Einstein Generative AI for Tableau(Link opens in a new window).
Get started with Tableau Pulse
- From the Tableau Cloud home page, expand the left side pane, and choose Pulse.
- From Tableau Pulse, Create Metrics with Tableau Pulse, if metrics haven’t been created yet.
- Use the Search bar or Browse Metrics tab to find existing metrics, and choose Follow to start receiving insights about specific metrics.
- From the More Actions menu (...) of a metric card, you can manage followers, see details, or view related metrics (metrics that share a core metric definition but have different filters or time contexts).
For a detailed explanation and example of how metric definitions and metrics work, see Metric definitions and metrics.
Explore metrics in detail, adjust the time range, or apply filters
From the Insights Exploration page, you can understand the metric at a glance, including:
- The current metric value.
- The percentage change from the prior period being compared.
- Filters applied to the metric definition.
- And insights about that metric.
From the metric page, choose Filter to change the time period being analyzed. You can also adjust the filtered values applied to the metric.
All users can adjust filter values and follow different metrics based on the same definition. When a user follows a metric, the time period and filter selections are preserved in their home page and digests.
The Overview tab shows a line chart of your metric’s performance, including the direction the metric is trending. Hover over different points of the line chart to see the metric’s value at different points in time.

The Breakdown tab shows you how different values in your metric are contributing to the total value. And you can choose the dimension by which you see your metric broken down. For example, this metric displays Region by default, but you can also break down the metric by Regional Manager or Segment.

If there's a data source goal or threshold set on the definition for a metric, you can adjust the chart details to show goal or threshold data for each contributor. By default, the breakdown chart shows a comparison to data from the prior period. The chart details option doesn’t appear for metrics with manual goals or thresholds set.
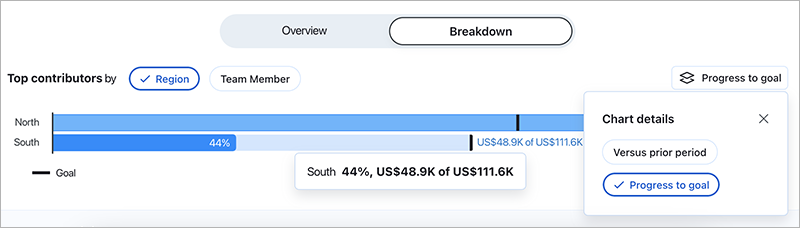
Tableau Pulse provides a path for exploring your data by surfacing questions for each insight that it detects for a metric. As you click through the suggested questions about your data, answers are revealed in easy-to-read charts with insights about the underlying data.

If you don't see an insight you are looking for, click the Ask button to the left of the available questions, and then enter a new question about the metric. Based on your question, Tableau Pulse will look for and rank semantic matches for insights that it detects for the same metric you're investigating. It then lists a question for each detected insight. The filter settings and data available for the metric affect the insights that Tableau Pulse can detect.
When Tableau Agent in Pulse is turned on in Tableau Pulse, you can see suggested questions in the Tableau Pulse home page based on metrics grouped by data source, definition, or time range. Selecting a question takes you to a page with key insights, relevant visualizations, source references, and suggested follow-up questions to help you dig deeper. Tableau Agent in Pulse is powered by AI in Tableau, so you can ask questions in your own words to get natural language answers about your data. For more information, see Ask Questions and Discover Insights in Tableau Pulse(Link opens in a new window).
Follow metrics
When a metric definition is created, you can follow its related metrics, i.e. versions of that core metric definition that can be created by applying adjustable filters. After you follow a metric, it appears on your Tableau Pulse homepage. You can also choose how frequently you receive Tableau Pulse digests via Slack and email. These digests include insights into important changes in your data so you can stay up to date. By default, digests are sent weekly to both Slack and email.
When you follow two or more metrics, Tableau Pulse provides an overview to help you quickly see the latest insights across your metrics of interest. When available, this insights summary appears in digests and in the Tableau Pulse home page.
Note: AI in Tableau must be turned on by your Tableau admin for insight summaries to be available.
To unfollow a metric, go to the metric exploration page and click Following. You can also choose the More Actions menu (...) from a metric card and choose Unfollow. If you unfollow a metric, then it no longer appears on your Tableau Pulse home page or in your digests. If you follow a metric as part of a user group, then you can’t unfollow the metric. Your group(s) must be removed from the follower list, and then you can follow or unfollow metrics as an individual. And in Microsoft teams, you can interact with Tableau Pulse metrics in the embedded Tableau experience. For more information, see the GitHub documentation for the Tableau app for Microsoft Teams(Link opens in a new window).
Customize your home page and digests
Customize your Tableau Pulse home page by sorting, grouping, or filtering metrics. Sort metrics by time range or recently followed. Group metrics that share a metric definition or a data source. Filter metrics to show only your favorites.
- On your Tableau Pulse home page, select Sort by or Filter by.
- Select how you want your metrics to be filtered or sorted, for example, grouped by metric definition.
- For the sort order, choose Set as Default Order to apply this to your Tableau Pulse home page, Tableau Mobile Pulse tab, Slack digest, and email digest. To filter the metrics that you receive in digests, see Manage your Tableau Pulse digest.
You can also mute metrics from your insight summary without unfollowing the metric. Your insight summary appears at the top of your home page and in your digests. The cards for muted metrics still appear on your Tableau Pulse home page and in your digests.
- Open your Tableau Pulse home page.
- From the metric you want to mute, select the More actions option (three vertical dots).
- Select Mute from Insights Summary.
To unmute a metric, find the metric on your Tableau Pulse home page, and select the More actions option (three vertical dots). Then select Include in Insights Summary.
Note: Your insight summary generates when you follow two or more metrics. If your insight summary isn’t generating, follow more metrics or unmute followed metrics.
Manage your Tableau Pulse digest
- From Tableau Pulse, select your user icon in the upper-right corner, then select Preferences.
- Choose how you want to receive digests (Slack and email).
- Choose how frequently you want to receive digests (daily, weekly, or monthly).
- Choose whether to receive all of the metrics that you follow or only favorites. This setting affects only the metric cards that appear in digests. You continue to receive alerts for all of the metrics that you follow.
- Select Save.
Email and Slack digests are sent to the email address associated with your Tableau site. To receive Tableau Pulse digests in Slack, your administrator must first Integrate Tableau with a Slack Workspace. You receive Tableau Pulse digests in the Tableau App for Slack automatically. But to experience all that the Tableau App for Slack has to offer–such as searching for vizzes, sharing vizzes, and receiving notifications–you must connect the Tableau App for Slack to your Tableau site. For more information about the Tableau App for Slack, see Receive Notifications, Search, and Share Using the Tableau App for Slack.
After you follow a metric, you receive Tableau Pulse digests in Slack in the Messages tab of the Tableau App for Slack.
Troubleshoot Tableau Pulse
Tableau Pulse is available on Tableau Cloud only. If you don’t have insights generated by AI in your Tableau Pulse summaries, your administrator might not have turned on these features for your site. For more information, see Set Up Your Site for Tableau Pulse.
Confirm that your preferred channels (Slack and email) are turned on to receive your Tableau Pulse digest. Email and Slack digests are sent to the email address associated with your Tableau account. If you’re not receiving your digest, check the email address associated with your account. Tableau Pulse email digests might not be formatted properly if you're using certain email clients, such as Thunderbird or older versions of Outlook.
You can also check your Tableau Pulse preferences to confirm that your digest is being sent at the desired frequency (daily, weekly, or monthly) via Slack and email. If your Tableau Pulse digest wasn’t ready in time, then you can view your metrics on the Tableau Pulse homepage.
If a metric you followed is no longer in your digest or on your Tableau Pulse home page, then the metric was deleted.