Tour Your Tableau Site
When you sign in to Tableau Server or Tableau Cloud, the first page you see looks similar to the following example.
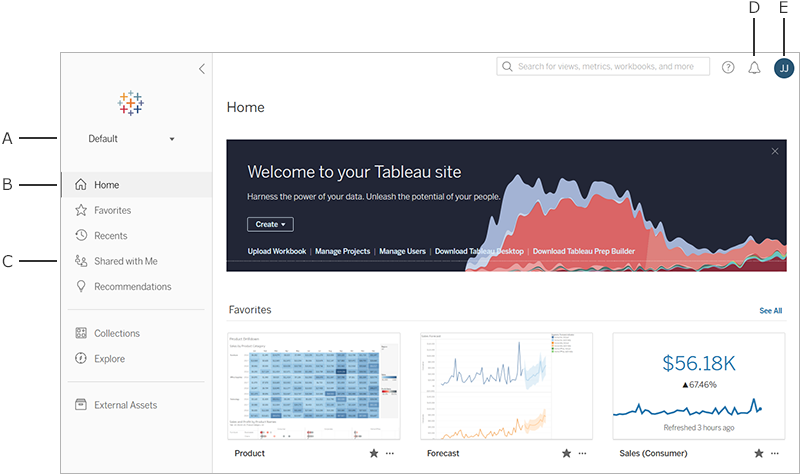
- A - Site picker (if you have access to more than one site)
- B - Home
- C - Navigation menu
- D - Notifications
- E - Your content and account settings
Note: You might see additional features if your site is licensed for Data Management, which includes Tableau Catalog, Tableau Prep Conductor, and other data management features. When Tableau Catalog is enabled, you can see an External Assets page, view data lineage information, and more. You can also see virtual connections listed as another Tableau content type. To learn more, see Use Data Management in the Tableau Cloud(Link opens in a new window) or Tableau Server(Link opens in a new window) help.
Browse and find content
To see all of the content you have access to across your Tableau site, from the navigation menu, click Explore. Your site role and permissions determine the content that you can see and the options that are available.
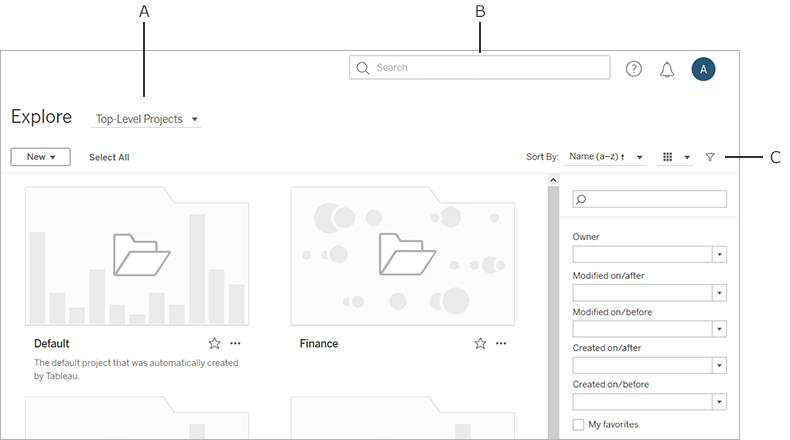
- A - Content type menu
- B - Quick search
- C - Filter the results
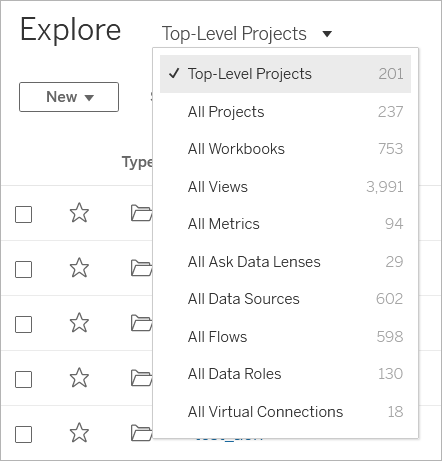
By default, Explore shows Top-Level Projects. To see other types of content, select them from the drop-down content type menu.
Projects
Projects provide a way to organize the content on your site. Top-level projects can contain other (nested) projects, forming a hierarchy that you navigate like the file system on your computer.
When you open a project, you see all of the content that project contains on a single page, including any nested projects.
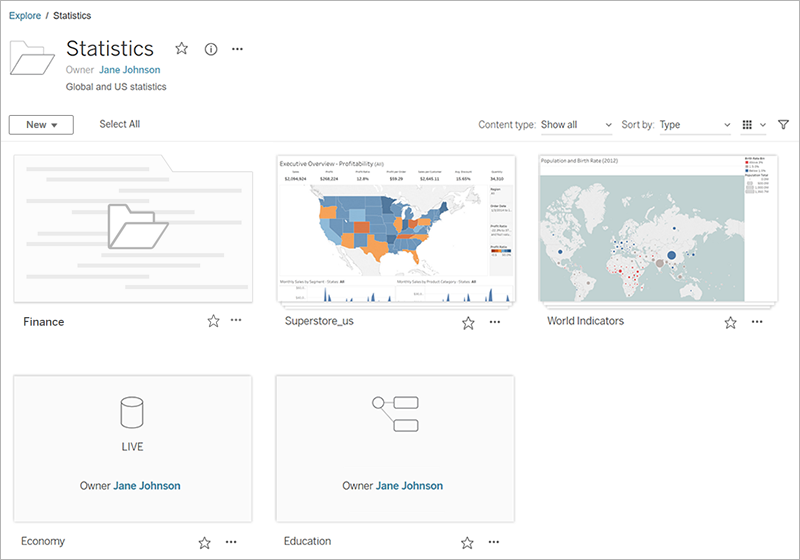
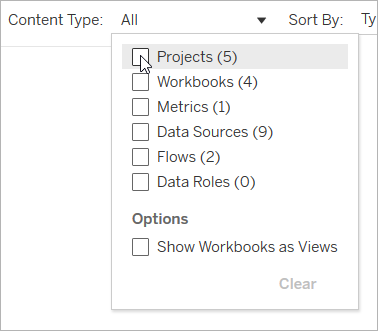
To see only specific content types in a project, click the Content Type drop-down menu and select the content types you want to see. You can select the Show Workbooks as Views option to see all of the individual views and custom views within a workbook displayed on the project page.
Workbooks
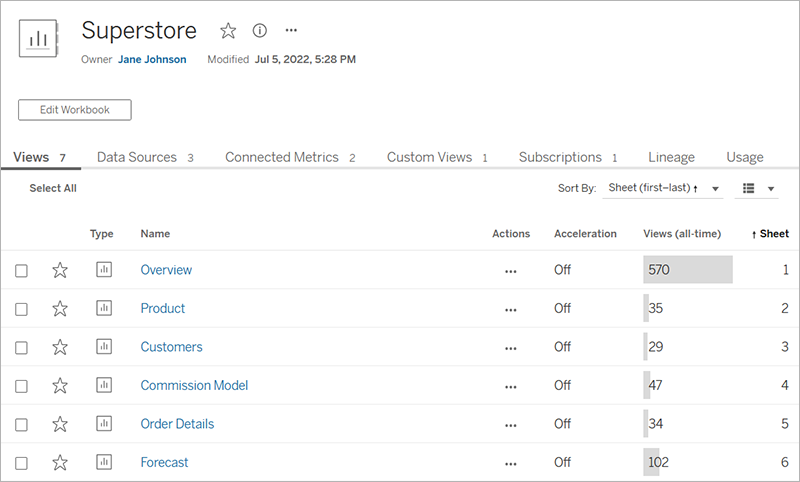
A workbook page shows the views included in the workbook, the data sources used by the workbook, metrics created from the views in the workbook, custom views, user subscriptions to either the workbook or to individual views, lineage data (if Tableau Catalog is enabled), and usage statistics.
For more information about creating workbooks, see Creators: Get Started with Web Authoring.
Views
A view page displays options for interacting with the view, including sharing, subscribing, and editing. The options available in the toolbar vary depending on the site configuration and your permissions.
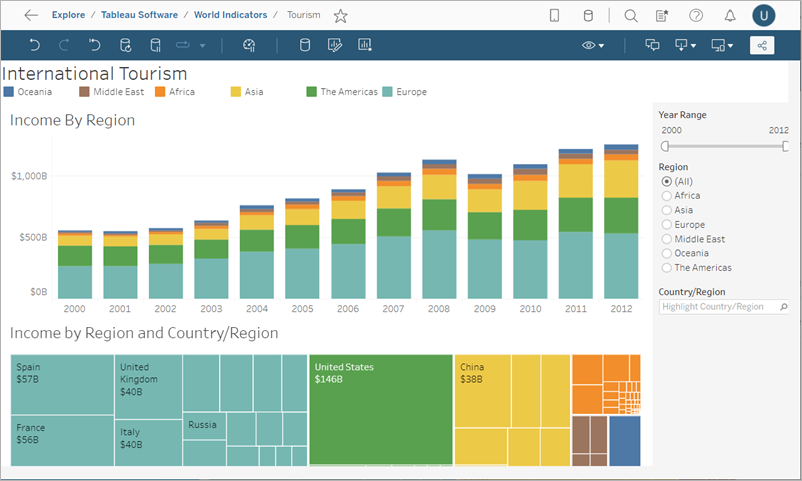
When a workbook is published from Tableau Desktop with the Show sheets as tabs option selected, you can see each sheet by clicking the tabs below the view toolbar.

For more information about working with views, see What Can I Do with a Tableau Web View?.
Metrics
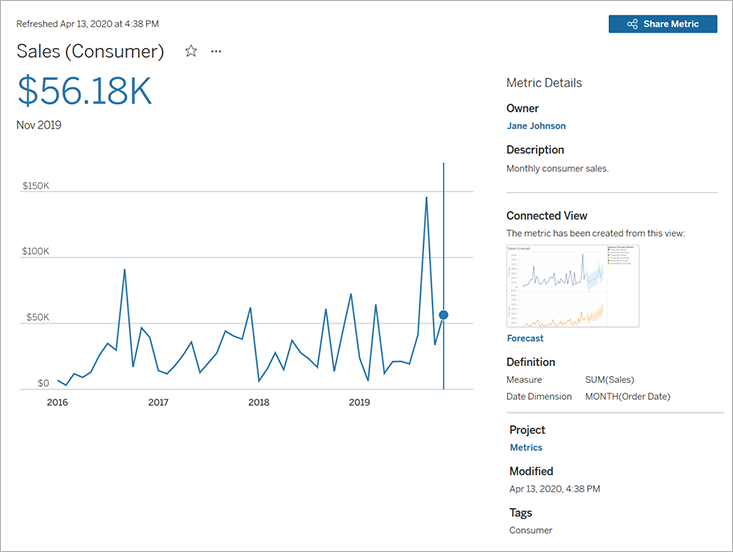
A metric page shows the current value for the metric, the time the metric last refreshed, and details about the metric, such as the owner, description, and definition. If the metric has a date dimension as part of its definition, it will show a timeline that displays historical values for the metric.
For more information about metrics, see Create and Troubleshoot Metrics (Retired).
Retirement of the legacy metrics feature
Tableau's legacy metrics feature was retired in Tableau Cloud in February 2024 and in Tableau Server version 2024.2. In October 2023, Tableau retired the ability to embed legacy metrics in Tableau Cloud and in Tableau Server version 2023.3. With Tableau Pulse, we've developed an improved experience to track metrics and ask questions of your data. For more information, see Create Metrics with Tableau Pulse to learn about the new experience and Create and Troubleshoot Metrics (Retired) for the retired feature.
Data sources
A data source page shows connections to databases or file-based data, as well as the workbooks connected to the data source. If the data source is an extract, the page shows scheduled extract refreshes.
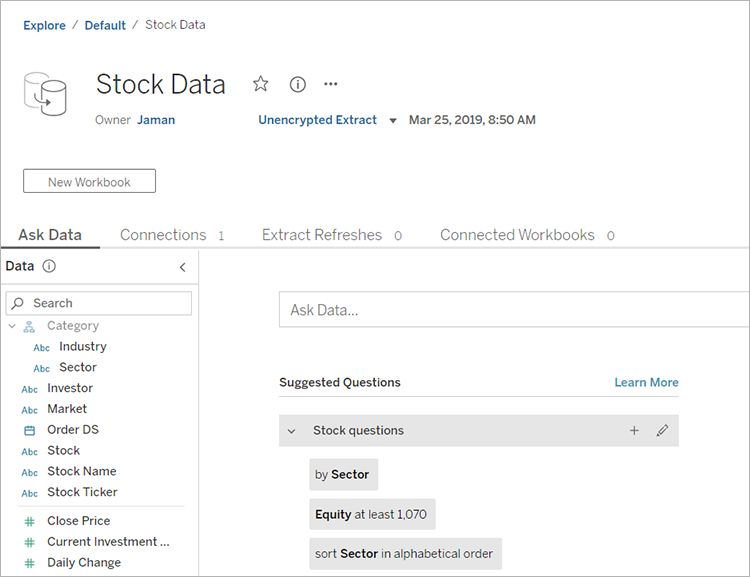
You can use Ask Data to investigate your data right from the data source page. Type a question and instantly get a visualization as an answer. For more information, see Automatically Build Views with Ask Data.
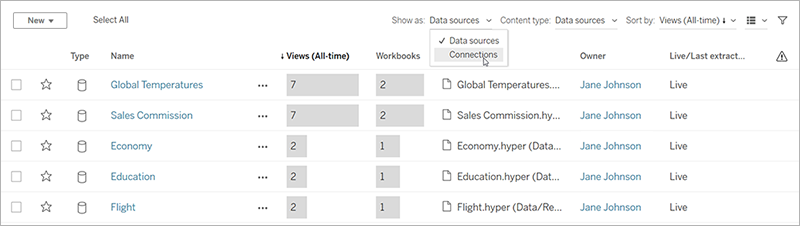
When viewing a list of data sources, to see connection and authentication details, from the Show As menu, select Connections.
Ask Data lenses
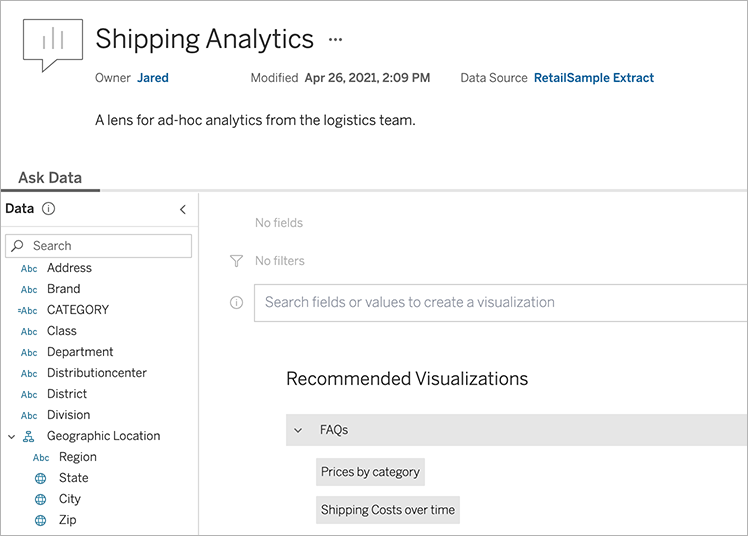
An Ask Data lens provides a curated subset of data from a data source, making it easier for you to find relevant answers to your questions. For more information, see Create Lenses that Focus Ask Data for Specific Audiences.
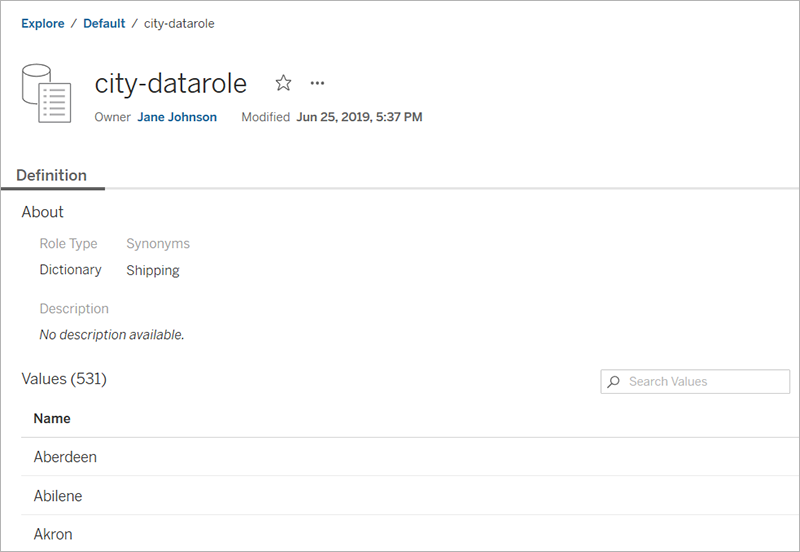
Data roles
A data role page shows custom data roles published to your site or server. You can create custom data roles in Tableau Prep Builder using the field values in your data set and publish them to Tableau Server or Tableau Cloud to share with others. You can use data roles to validate field values when cleaning your data.
For more information about creating and using data roles to clean data, see Use Data Roles to Validate Your Data(Link opens in a new window) in the Tableau Prep online help.
Flows
The flow page enables you to view, edit, monitor, and maintain your flow and run it on demand. If you have a Data Management license with Tableau Prep Conductor enabled, you can schedule your flow to run or set up linked tasks to run multiple flows one after the other.
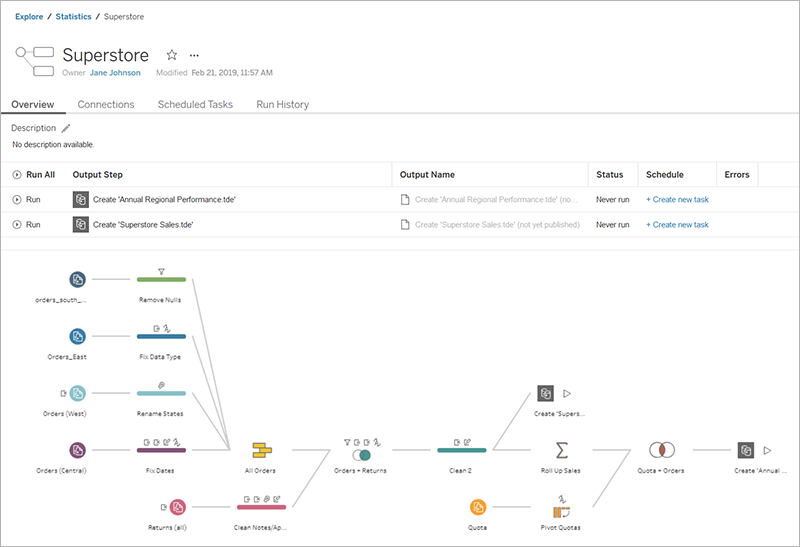
For more information about working with flows, see Keep Flow Data Fresh in the Tableau Prep help.
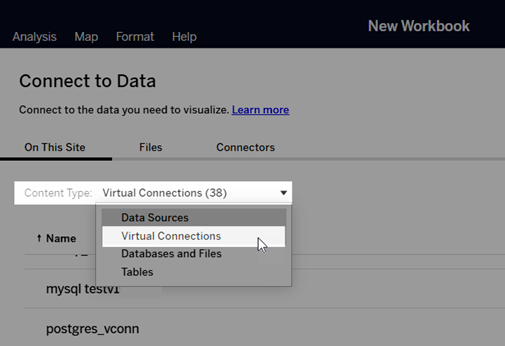
Virtual connections
Virtual connections provide a central access point to data. You can use a virtual connection to create a data source, workbook, or flow. You can trust that the data is fresh because the extract refresh schedule has already been set. And you can share content freely, knowing that you won't put security at risk because data policies that apply row-level security are always enforced. For more information, see Use a Virtual Connection in the Tableau Cloud(Link opens in a new window) or Tableau Server(Link opens in a new window) help.
Access important content quickly
In addition to browsing content in projects, take advantage of the following areas of your site to keep track of the items that are important to you:
- Personal Space - a private location for Explorers and Creators to save or edit work. For more information, see Create and Edit Private Content in Personal Space.
- Favorites - Add any type of content to your favorites.
- Recents - See the views, metrics, and flows you have most recently accessed.
- Shared with Me - Find items that other users have sent you.
- Collections - Create your own collection of related items, or access collections made by other users. For more information, see Organize Items in a Collection.
View content as list or grid
You can display content as a list or as a grid of thumbnails by clicking the View As icons.
Here's the list view:
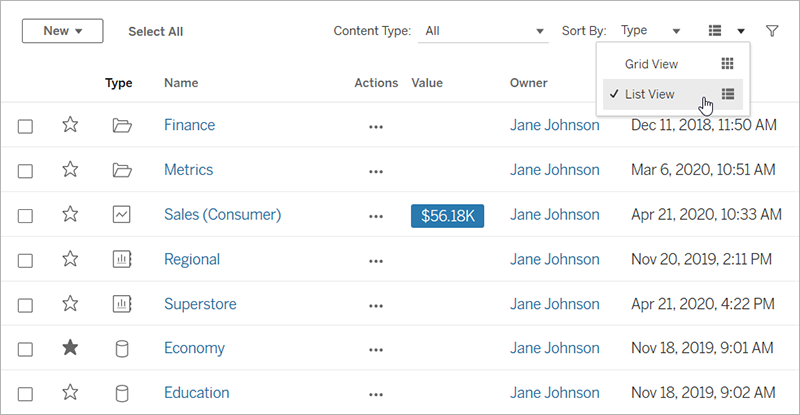
In list view:
-
 indicates a project
 -
 indicates a workbook
 -
 indicates a view
 -
 indicates a metric
-
 indicates an Ask Data lens
 -
 indicates a data source
 -
 indicates a data role
 -
 indicates a flow
 -
 indicates a virtual connection
And here's the grid view:
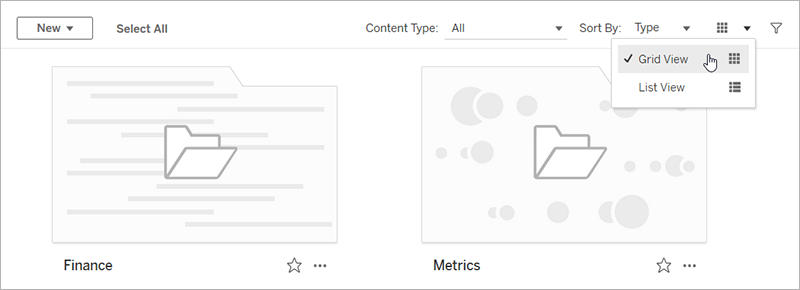
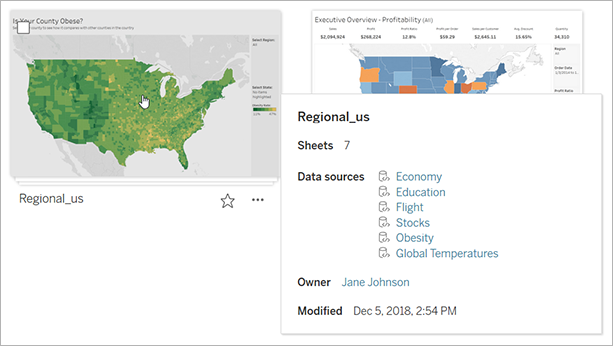
In grid view, you can hover over thumbnails to see details about the content.
Sort content
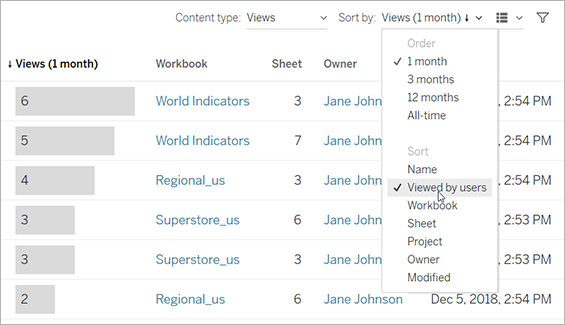
To sort items, click the Sort By drop-down menu. You can sort by characteristics such as name, owner, number of views, and creation date.
This example shows the sort options for number of page views.
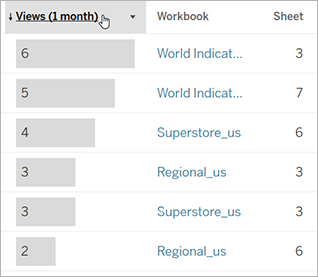
You can also sort a list by clicking the column heading. An arrow indicates the order: ascending (up arrow) or descending (down arrow).
Identify and navigate sites
Each site on Tableau Server and Tableau Cloud has a name and an ID.
On Tableau Server, if only one site exists, that site is named Default. When you’re signed in to the Default site, the browser URL looks something like this:
https://server-name/#/home
If you have access to multiple sites, you select one when you sign in.
On Tableau Cloud or an instance of Tableau Server running multiple sites, the browser URL includes #/site/ followed by the site ID. If the URL doesn't include /site, then you’re signed in to the Default site.
The following URL shows an on-premises Tableau Server site whose site ID is finance:
https://localhost/#/site/finance/home
Once signed in, you can navigate to another site by selecting it from the site picker. If you have access to only one site, you will not see the site picker.
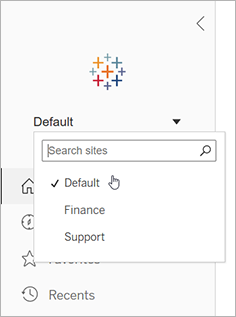
Tableau Pulse
Available for Tableau Cloud, Tableau Pulse helps you to stay up to date with your data by providing insights about metrics. You can follow metrics to receive a digest with changes to your data via email or Slack, and you can visit a metric's details page on Tableau Cloud to ask questions of the data and learn more.
Metrics in Tableau Pulse are based on data sources published to your Tableau site, but Tableau Pulse metrics are separate from the other content on your site and don't appear in projects under Explore. To access Tableau Pulse, from the navigation menu, select Pulse. For more information, see Create Metrics with Tableau Pulse.
