What Can I Do with a Tableau Web View?
You’ve seen hundreds of presentations, emails, and documents with data charts. Those things are static and sad. First off, the data is frozen in time. Second, if you have any questions about it, you’ve got to ask whoever created the chart . . . if you can find them.
Tableau is different. When someone sends you a link to a web view, you’re often seeing the freshest data available, and more importantly, you can interact with it. Want to dig deeper and answer questions the minute they occur to you? Simply click the view right in your web browser; it’s that simple.
What can you do with a Tableau web view? A lot!
Note: We’re covering the most popular ways you can interact with views. Sometimes, view creators enable only a subset of these features.
Will I hurt the data?
Not at all. When you interact with a view, you’re simply changing how it looks for a moment. Next time you or your colleagues open the view, it will look exactly as it originally appeared. The underlying data always remains safe and sound, so feel free to explore!
Filter and sort data
Want to trim or rearrange the visible data so you can focus on stuff you’re interested in? You’ve got a couple easy options:
Filter data
Most view creators add filters that let you limit visible data to specific date ranges, regions, and categories. When you see these, feel free to click or drag them as needed.

Click the image above to replay the animation.
Sort data
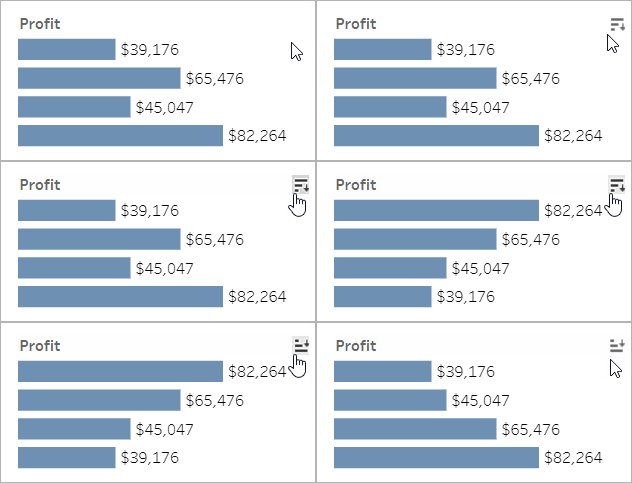
If you’re looking at a table of data and want to sort it alphabetically or numerically, just hover over a column header and click the sort icon.

Click the image above to replay the animation.
See details about specific data points
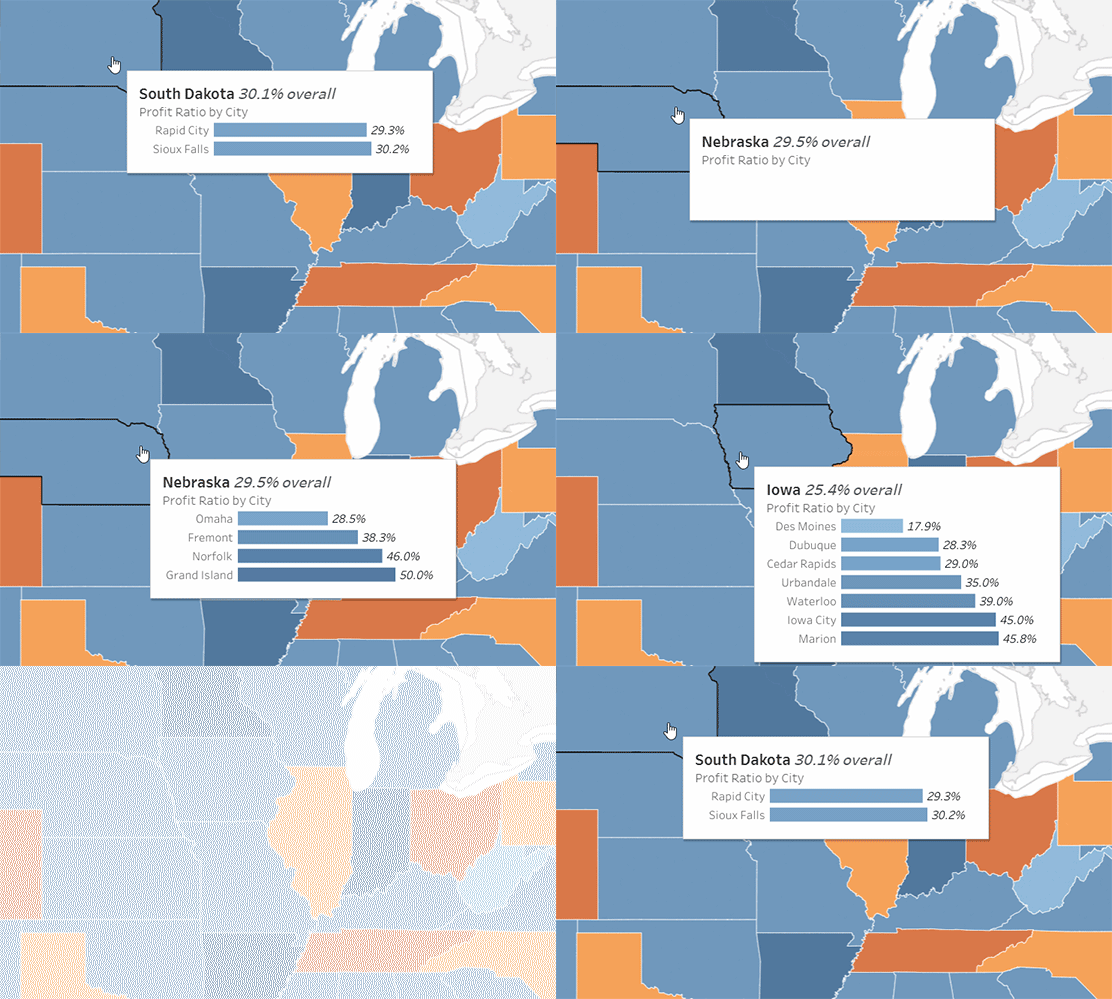
As you move the mouse across a view, you’ll often see tooltips that reveal details about each data point, or mark. Marks can take many forms; here’s how they look in maps, bar charts, and tables:

Click the image above to replay the animation.


View underlying data
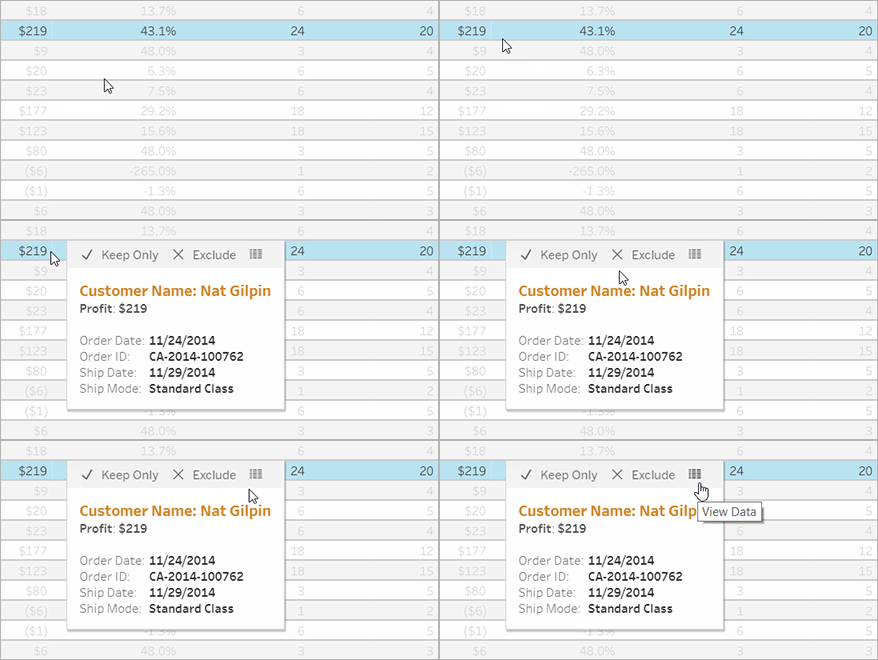
If you’re the inquisitive type, you might want to see summarized source data to get a better sense of the numbers behind the visuals. If the view creator has given you permission, you can click any mark in the view, and then click the View Data icon.

Click the image above to replay the animation.
Collaborate on data
Data becomes more meaningful when you explore it with other people.
Add comments
To quickly ask questions or share insights, click the comments icon in the toolbar. You can pair your remarks with a snapshot of the view that reflects any filters or other changes you made.

Share links
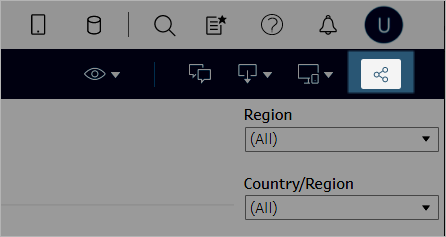
Want to share the excitement of directly engaging with data? Click Share in the toolbar, copy the link to the view, and then email or instant-message it to anyone with a Tableau account at your organization.


Get views emailed to you on a schedule
To automatically receive emails of a view on a regular schedule (before weekly meetings, for example), click Watch > Subscriptions in the toolbar.

Note: You might also receive emails to views that other people have arranged for you, including data-driven alerts that notify users when data crosses key thresholds for your business.
Download a view
You’ve seen the power of interactive Tableau web views. But there are times when you want to show off that data outside the browser. If the view creator has given you permission, click the download icon in the toolbar to create a static .png, .pdf, or .pptx file that reflects the view as it looks right now.

Find a recently accessed view
If you come across an interesting view but later forget where you found it, don’t worry. Tableau keeps track for you. You can find your 12 most recently accessed views on the Recents page, which you can open from the navigation panel.

You can also find a smaller selection of your most recently accessed views on the Home page.
Add a view to favorites
As the Tableau content in your organization grows, you’ll want to easily find data important to you. To add a view to your favorites, click the star icon in the header.

To return to a favorite, open the Favorites page from the navigation panel.
Favorites you choose in Tableau Server or Tableau Cloud also appear in the Tableau Mobile app, and vice versa, giving you instant access to key data wherever you go.
Congratulations, data rockstar!
See how easy that was? Now that you’re familiar with web views, start exploring all the Tableau content available at your company. Answer questions. Share insights. You’ve got this!
