The Mapping Workspace in Tableau
The mapping workspace in Tableau consists of the following elements.

 The Data Pane
The Data pane organizes your location data into dimensions and measures. Typically, your location fields (country, state, and city names, for example) should be dimensions, and your latitude and longitude fields should be measures. However, there are some scenarios where latitude and longitude fields can be dimensions.
In the Data pane, a globe icon next to a location field means that a geographic role is assigned to that field. For more information, see Assign Geographic Roles (Link opens in a new window).
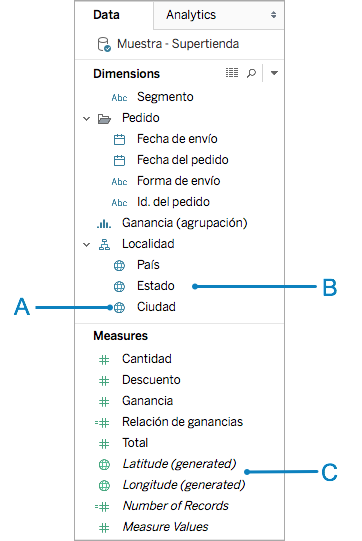
A: Globe icon - indicates that a field is a geographic field and can be automatically mapped by Tableau.
B: Location fields - These categorical fields, often location names, can be found under Dimensions. They are often recognized by Tableau.
C: Latitude and Longitude generated fields - When you have geographic fields in your data source, Tableau often generates Latitude and Longitude fields. You can use these to build your map, or you can include your own latitude and longitude fields.
 The Marks Card
The Marks card is where you control the granularity and visual detail of your map view. In the Marks card, you can drag locations to Detail to add more granularity, drag fields to Color, Size, or Label to add visual detail, or change the map type from a point map to a polygon map.

A: Add location fields to Detail to create a map and add granularity to the view.
B: Select the Automatic mark type for a point map and the Map mark type for a polygon (filled) map.
C: Add fields to Color, Size, and Label to change the visual detail of the marks (data points) in the view.
 The View Toolbar
The view toolbar holds many of the tools you might need to explore your map data.

A: Use the map search icon to search for locations in your map.
B: Use the plus and minus icons to zoom in and out of the map.
D: Use the zoom area icon to zoom in to a specific area in the map.
E: Use the pan icon to pan around the map.
F: Use the selection tools to select data points within a rectangle, circle, or drawn area. You can also measure distances with the circle selection tool. For more information, see Measure Distances Between Data Points and Locations in a Map(Link opens in a new window).
 The Map Menu
The Map menu holds several maps-specific options:
-
Select Map > Background Maps to add a map service (such as Mapbox or a WMS server) or to switch between the background maps you have available in your workbook. For more information, see Import your own background map.
-
Select Map > Background Images to add a static image instead of a background map to your view.
-
Select Map > Geocoding to import locations that Tableau does not recognize into your workbook. For more information, see Geocode Locations Tableau Does Not Recognize and Plot Them on a Map(Link opens in a new window).
-
Select Map > Edit Locations to edit your location data to match the Tableau map data. For more information, see Edit Unknown or Ambiguous Locations(Link opens in a new window).
-
Select Map > Map Layers to customize your background map style, add or remove map layers, or add U.S. data layers. For more information see Customize How Your Map Looks(Link opens in a new window).
-
Select Map > Map Options to control if people can pan and zoom, search for locations, or use the view toolbar. For more information, see Customize How People Interact with your Map(Link opens in a new window)
 The Columns and Rows Shelves
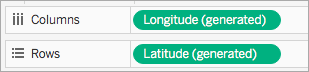
The Columns and Rows shelves are where you put your latitude and longitude fields. Longitude is placed on the Columns shelf, and Latitude is placed on the Rows shelf, regardless of whether they are your latitude and longitude fields, or the generated fields Tableau creates.
 The Map Visualization
This is your map. As you makes changes to your map, the viz updates. This visualization is dynamic and can be interacted with. Hover over the marks to learn more information about each location. You can edit the information that displays in the tooltip that appears using the Tooltip button on the Marks card. For more information, see Add tooltips to marks(Link opens in a new window) and Create Views in Tooltips (Viz in Tooltip)(Link opens in a new window).
In addition to the options available in the mapping workspace, Tableau provides many other options for analyzing your data. You can create custom territories(Link opens in a new window), filter data from your view(Link opens in a new window), set up parameters(Link opens in a new window), create sets(Link opens in a new window), and much more.
See Also
Get Started Mapping with Tableau(Link opens in a new window)