Customize How Your Map Looks
This article describes how you can customize the appearance of a map view in Tableau.
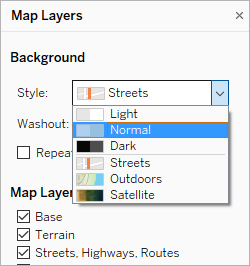
Note: Many of the tasks in this article make use of the Map Layers pane. To open this pane, select Map > Map Layers. In older versions of Tableau, select Map > Map Options.
Select a Tableau background map style
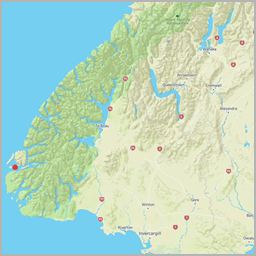
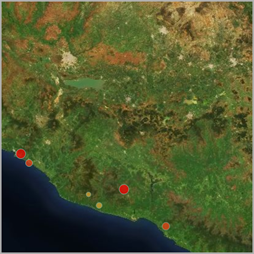
When you are connected to the Tableau background map, you can choose between six built-in background map styles: Normal, Light, Dark, Streets, Outdoors, and Satellite. You can see these styles below:
| Normal | Light | Dark |
|
|
|
| Streets | Outdoors | Satellite |
|
|
|
To select a Tableau background map style:
-
Select Map > Map Layers.
-
In the Map Layers pane on the left-hand side of the workspace, under Background, click the Style drop-down menu, and then select a background map style.
For more information about the built-in Tableau background maps, see Select Background Maps(Link opens in a new window).
Import your own background map
If the built-in Tableau background map styles don't meet your needs, you can import your own background map from a Web Map Service (WMS) server or a Mapbox map.
To import your own background map:
-
Select Map > Background Maps > Map Services.
-
In the Map Services dialog box, click Add, and then select to add WMS servers or Mapbox maps.
-
Follow the prompts to connect Tableau to the map service of your choice.
For more information, see Use Web Map Service (WMS) Servers(Link opens in a new window) or Use Mapbox Maps(Link opens in a new window).
-
When finished, click Close.
-
Select Map > Background Maps, and then select the background map you want to use.
The map updates to include the background map you choose.
Add a static background image
In addition to importing your own background map, you can add a static background image to your workbook and plot your data on it. For example, you can take a Google Map image and plot your data on it.
For more information, see the following topics:
- Use Background Images in Your Views(Link opens in a new window)
- Add Images of Google Maps and OpenStreetMap as Background Images in Tableau(Link opens in a new window)
- Find Background Image Coordinates(Link opens in a new window)
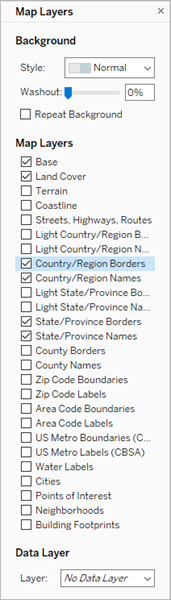
Show or hide map layers
If you are using the Tableau background map, or a WMS map or Mapbox map that contains custom layers, you can show or hide layers on your background map to customize the background elements that frame your geospatial data. For example, you can overlay streets and highways or county boundaries on the map to give your data context.
To add or subtract map layers:
-
Select Map > Map Layers.
-
In the Map Layers pane, under the Map Layers section, select one or multiple map layers.
Note: Some map layers are only visible at specific zoom levels. If a map layer is unavailable at your current level of zoom, it will appear grayed out.
To use layers that are not available, zoom further in to the view.
Some map layers are built to work with certain styles. What follows is a description of the different map layers available. Some of these layers are only available when using certain map styles.
| Layer Name | Description | present in map style |
|---|---|---|
| Base | Shows the base map including water and land areas. | All |
| Land Cover | Shades wilderness areas and parks to give the map more depth. | All except Satellite |
| Terrain | Displays a relief of vertical elevation changes. | All except Satellite |
| Coastlines | Displays coastlines. | Light, Dark, Normal |
| Streets, Highways, Routes | Marks freeways and highways as well as small city streets. This layer includes the highway and street names as well. | All |
| Light Country/Region Borders | Shows a light gray outline of country/region borders and names. | Light, Dark, Normal |
| Light Country/Region Names | Shows country and region names in a light gray. | Light, Dark, Normal |
| Country/Region Borders | Highlights country and region borders in a darker gray. | All |
| Country/Region Names | Highlights country and region names in a darker gray. | All |
| Light State/Province Borders | Shows a light gray outline of state borders and names. | Light, Dark, Normal |
| Light State/Province Names | Shows state and province names in a light gray. | Light, Dark, Normal |
| State/Province Borders | Highlights state and province borders in a darker gray. | All |
| State/Province Names | Highlights state and province names in a darker gray. | All |
| County Borders | Highlights second-level administration borders and US county borders. | Light, Dark, Normal |
| County Names | Highlights second-level administration names and US county names. | Light, Dark, Normal |
| Zip Code Boundaries |
Marks zip code and postcodes boundaries for US and select countries. You must zoom in to see this layer. |
Light, Dark, Normal |
| Zip Code Labels | Shows labels of zip code and postcodes boundaries for US and select countries. You must zoom in to see this layer. | Light, Dark, Normal |
| Area Code Boundaries | Marks US area code boundaries. You must zoom in to see this layer. | Light, Dark, Normal |
| Area Code Labels | Shows labels for the US area codes. You must zoom in to see this layer. | Light, Dark, Normal |
| US Metro Boundaries (CBSA) | Marks US Metropolitan Statistical Areas and Micropolitan area boundaries. | Light, Dark, Normal |
| US Metro Labels (CBSA) | Shows labels for the U.S. Metropolitan Statistical Areas and Micropolitan areas. | Light, Dark, Normal |
| Water Labels | Shows labels for bodies of water. | All |
| Cities | Shows labels for cities. | All |
| Points of Interest | Displays labels for points of interest such as schools, parks, cemeteries, businesses, and important buildings. This layer is dependent on the zoom level. | All |
| Neighborhoods | Shows labels for neighborhoods in cities. You must zoom in to see this layer. | All |
| Subway and Train Stations | Displays the names of subway and train stations. You must zoom in to see this layer. | All except Satellite |
| Building Footprints | Shows the outline of buildings, where available. You must zoom in to see this layer. | Satellite, Streets, Outdoors |
| House Numbers | Displays the house numbers of buildings, with and without building footprints. You must zoom in to see this layer. | Streets, Outdoors |
| Contour Lines | Displays lines indicating vertical elevation change in meters. This layer is dependent on zoom level. | Outdoors |
Add layers for U.S. demographic data
If you are using the Tableau background map, you can turn on a variety of predefined data layers that show U.S. census information. The data in these layers is for demographic data collected from the U.S. ACS Census.
Note: Map data layers are only available for locations in the U.S.
To add data layers for locations outside the U.S. you can connect to a WMS server that contains the desired demographic information. For more information, see Use Web Map Service (WMS) Servers(Link opens in a new window).
To add a U.S. data layer to your map view:
-
Select Map > Map Layers
-
In the Map Layers pane, under Data Layer, do the following:
Click the Layer drop-down menu and select a data layer.
Click the By drop-down menu, and then select to layer the data by State, County, Zip Code or Block Group.
Click the Using drop-down menu to select a color scheme.
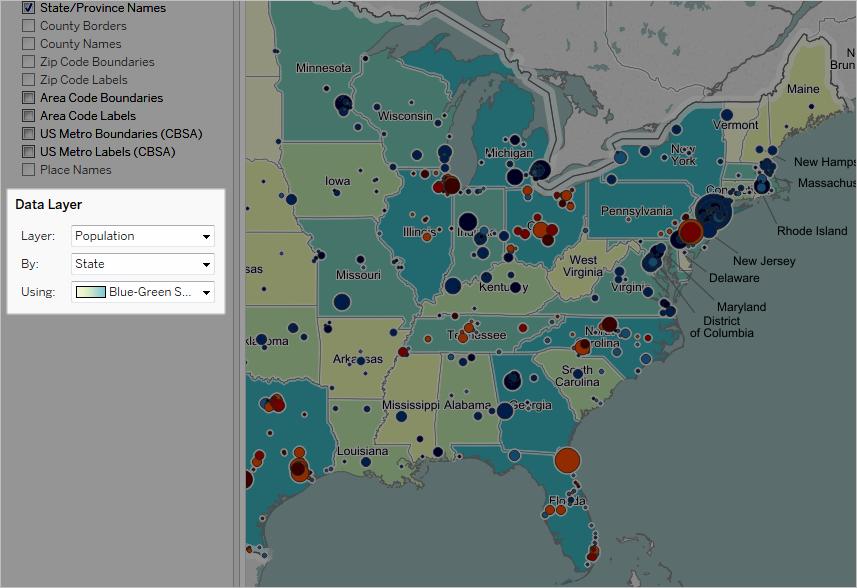
Once you select a data layer, it is added as shading to the map and a legend is shown to explain the colors of the layers. To hide or show this legend at any time, select Map > Map Legend.
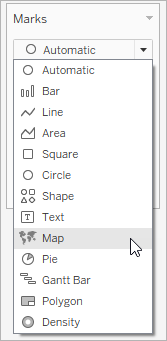
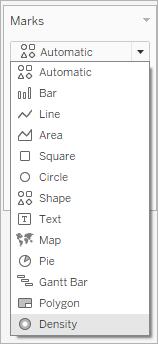
Change the mark type
By default, when you add a geographic field to the view, Tableau creates a point map. You can change this to a polygon (filled) map, a line map, or a density map (heatmap).
Note: Filled maps are not available at the city or postcode level.
To change a point map to a filled or line map:
-
On the Marks card, click the Mark Type drop-down and select Map.
To change a point map to a heatmap (density map):
- On the Marks card, click the Mark Type drop-down and select Density.
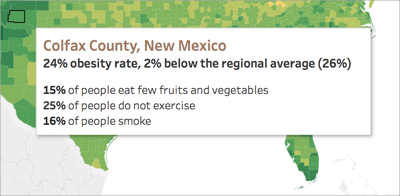
Add levels of detail
With maps, for each level of detail you add, the more granular your data becomes. For example, you might look at obesity rates at the state level, or you could drill down into the county level, like the examples below. Adding or subtracting levels of detail changes the make up of your map.

To add levels of detail to the view:
- From Dimensions, drag a geographic field to Detail on the Marks card.
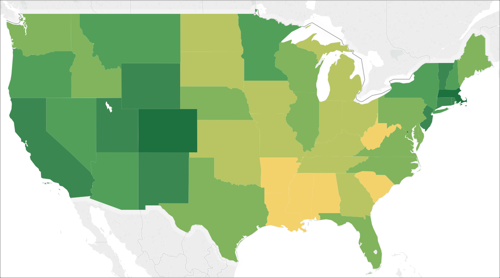
Add color
There are two ways you can add color to your map view: You can color locations categorically, or you can color locations quantitatively.
To color locations on your map categorically:
-
From the Data pane, drag a dimension to Color on the Marks card.
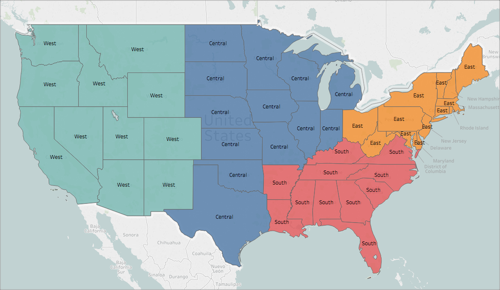
The image below shows each state in the U.S. colored by region: West, Central, South, and East. The dimension, Region, is on Color on the Marks card.
To color each location on your map quantitatively:
-
From the Data pane, drag a measure to Color on the Marks card.
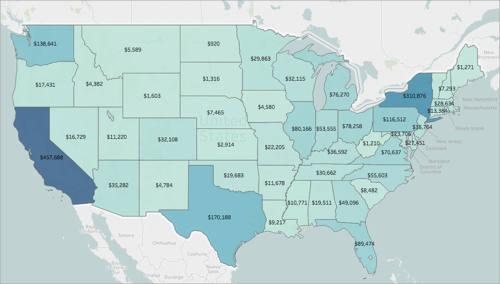
The image below shows each state in the U.S. colored by the amount of sales they achieved. The measure, Sales, is on Color on the Marks card.
For more information about color, see Color Palettes and Effects(Link opens in a new window).
Add labels
You can add labels to your locations to provide extra context. For example, you can add labels for location name and sales.
To add labels to your data, from the Data pane, drag a dimension or measure to Label on the Marks card.
A label appears in the center of your location (if a polygon), or to the side of your location (if a data point).
You can add multiple labels.

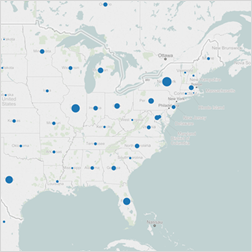
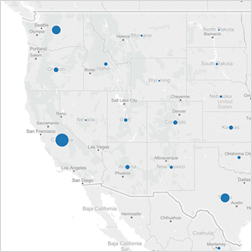
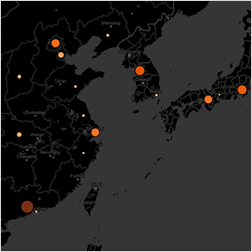
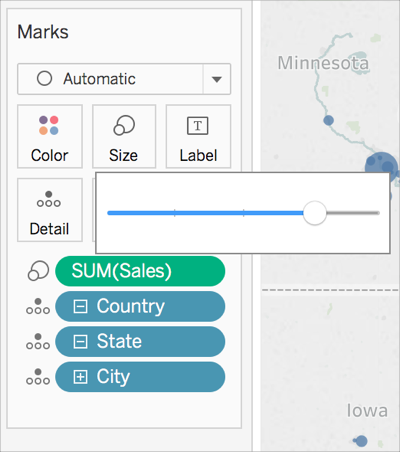
Adjust the size of your data points
You can adjust the size of your data points to compare and contrast them, or make smaller data points easier to see.
To uniformly adjust the size of your data points:
-
On the Marks card, click Size, and then adjust the slider to the left or right.
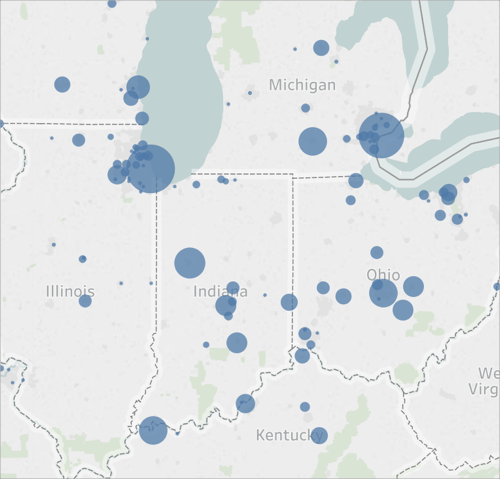
To size your data points quantitatively:
-
From Measures, drag a field to Size on the Marks card.
Create custom tooltips
You can create custom tooltips to show additional information about your locations when your audience hovers or clicks on them. You can type in your own information to appear for all marks, or add a field that will update with information specific to each mark.
To add a field to a tooltip:
- From the Data pane, drag the field to Tooltip on the Marks card.
To edit a tooltip:
-
On the Marks card, click Tooltip.
-
In the Edit Tooltip dialog box, format the tooltip how you would like it to appear.
For more information about customizing tooltips, see Format tooltips (Link opens in a new window) and Add tooltips to marks(Link opens in a new window).
See also:
Mapping Concepts in Tableau(Link opens in a new window)
Use Web Map Service (WMS) Servers(Link opens in a new window)