Create Sets
You can use sets to compare and ask questions about a subset of data. Sets are custom fields that define a subset of data based on some conditions.
You can make sets more dynamic and interactive by using them in Set Actions. Set actions let your audience interact directly with a viz or dashboard to control aspects of their analysis. When someone selects marks in the view, set actions can change the values in a set.
In addition to a Set Action, you can also allow users to change the membership of a set by using a filter-like interface known as a Set Control, which makes it easy for you to designate inputs into calculations that drive interactive analysis. For details, see Show a set control in the view.
Create a dynamic set
There are two types of sets: dynamic sets and fixed sets. The members of a dynamic set change when the underlying data changes. Dynamic sets can only be based on a single dimension.
To create a dynamic set:
-
In the Data pane, right-click a dimension and select Create > Set.
-
In the Create Set dialog box, configure your set. You can configure your set using the following tabs:
-
General: Use the General tab to select one or more values that will be considered when computing the set.
You can alternatively select the Use all option to always consider all members even when new members are added or removed.

-
Condition: Use the Condition tab to define rules that determine which members to include in the set.
For example, you might specify a condition that is based on total sales that only includes products with sales over $100,000.

Note: Set conditions work the same as filter conditions. See Filter Data from Your Views(Link opens in a new window) to learn more.
-
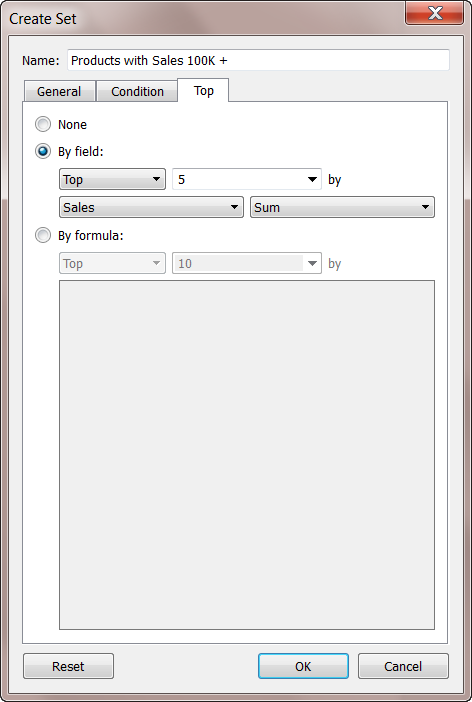
Top: Use the Top tab to define limits on what members to include in the set.
For example, you might specify a limit that is based on total sales that only includes the top 5 products based on their sales.
Note: Set limits work the same as Filter limits. See Filter Data from Your Views(Link opens in a new window) to learn more.
-
When finished, click OK.
The new set is added to the bottom of the Data pane, under the Sets section. A set icon
 indicates the field is a set.
Create a fixed set
The members of a fixed set do not change, even if the underlying data changes. A fixed set can be based on a single dimension or multiple dimensions.
To create a fixed set:
-
In the visualization, select one or more marks (or headers) in the view.
-
Right-click the mark(s) and select Create Set.

-
In the Create Set dialog box, type a name for the set.
-
Optionally complete any of the following:
-
By default, the set includes the members listed in the dialog box. You can select the option to Exclude these members instead. When you exclude, the set will include all of the members you didn't select.
-
Remove any dimensions that you don't want to be considered by clicking the red "x" icon that appears when you hover over a column heading
 .
. -
Remove any specific rows that you don't want to include in the set by clicking the red "x" icon that appears when you hover over the row
 .
. -
If the marks you selected represent multiple dimensions, each member of the set will be a combination of those dimensions. You can specify the character that separates the dimension values. To do so, for Separate members by, enter a character of your choice.
-
Select Add to Filters shelf to automatically move the set to the Filters shelf once it is created.

-
-
When finished, click OK.
The new set is added to the bottom of the Data pane, under the Sets section. A set icon
indicates the field is a set.
Add or remove data points from sets
If you created a set using specific data points, you can add more data to or subtract data from the set.
To add or remove data points from a set:
-
In the visualization, select the data points you want to add or remove.
-
In the tooltip that appears, click the Sets drop-down menu icon, and then select Add to [set name] or Remove from [set name] to add or remove data from a particular set.

Use sets in the visualization
After you create a set, it displays at the bottom of the Data pane in the Sets section. You can drag it into the viz like any other field.
When you drag a set to the viz in Tableau Desktop, you can choose to show the members of the set or aggregate the members into In/Out categories.
In Tableau Server or Tableau Cloud you can only aggregate the members of the set into In/Out categories.
Show In/Out members in a set
In most cases, when you drag a set to the viz, Tableau displays the set using the In/Out mode. This mode separates the set into two categories:
-
In - The members in the set.
-
Out - The members that aren't part of the set.
For example, in a set defined for the top 25 customers, the top customers would be part of the In category and all other customers would be part of the Out category.
Using the In/Out mode makes it easy to compare the members in the set to everything else.
To show In/Out members in the visualization:
- In Tableau Desktop, right-click the set in the visualization workspace and select Show In/Out of Set.

When a set is in In/Out mode, the field on the shelf is prefaced by the text, "IN/OUT", followed by the set name.
Note: In/Out mode is not available in workbooks created before version 8.2 that use Microsoft Excel or text file data sources, workbooks that use the legacy connection, or workbooks that use Microsoft Access data sources.
Show members in a set
As an alternative to showing the set using In/Out mode, you can list the members in the set. Showing the members in the set automatically adds a filter to the view that includes only the members of the set.
To switch a set to list the individual members:
- In the visualization workspace, right-click the set and select Show Members in Set.
Note:To display the fully qualified member names for cubes, right-click the set in the Data pane and select Qualify Member Names.
Let users change set values
Add a set action
You can use set actions to give your audience more control over their analysis of your visualization.
Set actions take an existing set and update the values contained in that set based on a user’s action in the viz. As the author, you can use a set or sets that you have already created to define the scope of the set action.
For details on how to create and use set actions, see Set Actions.
Show a set control in the view
To give your audience the ability to quickly modify members of a set, you can also display a Set Control. A set control is a worksheet card that is very similar to a parameter control or filter card. You can add set controls to worksheets and dashboards and they are included when you publish to Tableau Server or Tableau Cloud, or save to the web on Tableau Public.
To display the set control, right-click (Control-click) the set in the Data pane and select Show Set.
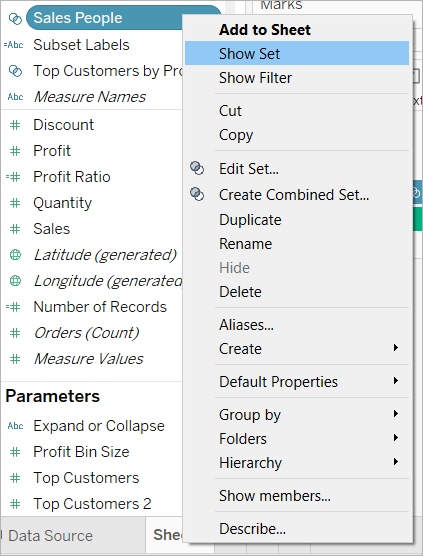
Like other cards, set controls have a menu that you can open using the drop-down arrow in the upper right corner of the card. Use this menu to customize the display of the control, which supports both single-value and multiple-value selection modes. For example, you can show radio buttons for individual selection, or a drop-down list that supports multiple selections.
Note: You can only display a set control for dynamic sets—not fixed sets. This is by design, as fixed sets aren’t meant to change in membership. In addition, if the dynamic set is not in play in the view (that is, if it’s not referenced in a calculation or instantiated on the sheet), the context menu item will be disabled, reminding you to add the set to the view.
Combine sets
You can combine two sets to compare the members. When you combine sets you create a new set containing either the combination of all members, just the members that exist in both, or members that exist in one set but not the other.
Combining sets allows you to answer complex questions and compare cohorts of your data. For example, to determine the percentage of customers who purchased both last year and this year, you can combine two sets containing the customers from each year and return only the customers that exist in both sets.
To combine two sets, they must be based on the same dimensions. That is, you can combine a set containing the top customers with another set containing the customers that purchased last year. However, you cannot combine the top customers set with a top products set.
To combine sets:
-
In the Data pane, under Sets, select the two sets you want to combine.
-
Right-click the sets and select Create Combined Set.
-
In the Create Set dialog box, do the following
-
Type a name for the new combined set.
-
Verify that the two sets you want to combine are selected in the two drop-down menus.
-
Select one of the following options for how to combine the sets:
-
All Members in Both Sets - the combined set will contain all of the members from both sets.
-
Shared Members in Both Sets - the combined set will only contain members that exist in both sets.
-
Except Shared Members - the combined set will contain all members from the specified set that don't exist in the second set. These options are equivalent to subtracting one set from another. For example, if the first set contains Apples, Oranges, and Pears and the second set contains Pears and Nuts; combining the first set except the shared members would contain just Apples and Oranges. Pears is removed because it exists in the second set.
-
-
Optionally specify a character that will separate the members if the sets represent multiple dimensions.
-
When finished, click OK.
Note: This functionality is not available in workbooks created before version 8.2 that use Microsoft Excel or text file data sources, workbooks that use the legacy connection, or workbooks that use Microsoft Access data sources.
Examples of sets
There are many ways you can use sets to answer complex questions and compare cohorts of data. Below are some examples of ways you can use sets to define and compare subsets of data.
You may have all kinds of questions surrounding how the members in a set contribute to the overall total. For example, what percent of total sales come from repeat customers? You can answer these types of questions using the IN/OUT mode for a set.
The example below uses sales data to create a set for customers who have purchased 5,000 USD or more in products.
Create the set
-
Right-click (control-click on Mac) the Customer Name dimension in the Data pane and select Create > Set.

-
In the Create Set dialog box, type a name for the set. In this example, we'll call the set, "Customers"
-
Select the Use all option so the condition always applies to all values even when new customers are added.
-
On the Condition tab, click By field, and then define a condition that only includes customers when Sum of Sales is greater than or equal to 5,000.

-
Click OK.
Create the visualization
-
Drag the new set from the Sets area at the bottom of the Data pane to the Rows shelf.
-
Drag Sales to the Columns shelf. The view now shows the total sales for customers who have purchased more than 5,000 USD of product and the total sales for all other customers.

-
Finally, click on the drop-down arrow on the Sum (Sales) field on the Column shelf and select Quick Table Calculation > Percent of Total on the context menu.
The view now shows that customers with sales greater than or equal to 5,000 make up about 39% of the overall sales.

Another common use of sets is to compare subsets of data or cohorts. For example, you may wonder how many customers that purchased last year also purchased this year. Or if a customer purchased a specific product, what other products did they buy? You can answer these types of questions by creating multiple sets and combining them. The example below uses sales data to determine how many customers who purchased in 2012 also purchased in 2013.
Create a combined set
-
Drag the Customer Name field to the Rows shelf.
-
Drag the Order Date field to the Filters shelf.
-
In the Filter Field dialog box, select Years and click Next.
-
In the Filter dialog box, select 2012 and click OK.

-
Back in the view, press CTRL + A (Command-A on a Mac) on your keyboard to select all of the customers.
-
Right-click (control-click on Mac) the selection and select Create Set.

-
In the Create Set dialog box that opens, type a name for the set. In this example, we'll call the set "Customers (2012)".
-
Click OK.
-
On the Filters shelf, right-click (control-click on Mac) Order Date and select Edit Filter.
-
In the Filter dialog box, change the filter to only include 2013 instead of 2012, and then click OK.

-
Again, press CTRL + A (Command-A on a Mac) on your keyboard to select all of the customers.
-
In the view, right-click (control-click on Mac) the selection and select Create Set.
-
In the Create set dialog box that opens, type a name for the set. This set will be called "Customers (2013)".
-
Click OK.
-
In the Data pane, select both the Customers 2012 and Customers 2013 by holding the Ctrl key (Command key on a Mac) on your keyboard as you select.
-
Right-click (control-click on Mac) the selection and select Create Combined Set.

-
In the Create Set dialog box, type a name for the new set. In this example, we'll call the set "Customers (2012 & 2013)".
-
Make sure the correct two sets are selected in the drop-down menus.
-
Select the option to include Shared Members in Both Sets.

-
Click OK.
Create the visualization
-
At the bottom of the workbook, click the New Worksheet
 icon.
icon. -
In the new worksheet, drag the Customer Name dimension to the Rows shelf.
-
Click the drop-down arrow on the Customer Name field on the Rows shelf and select Measure > Count (Distinct) from the context menu.
-
Finally, from the Sets area of the Data pane, drag the Customers (2012 & 2013) field to the Filters shelf. You can see that 437 customers purchased products in both 2012 and 2013.

A hierarchical set filters data to the selected members and all of their descendants. They are unique to multidimensional (cube) data sources and are defined within the data source prior to connecting to Tableau Desktop.
When you create sets in Tableau from a cube data source, descendants and any hierarchical structures are automatically included with the selected members.
For example, a set named Dairy is created from the Product hierarchy. As shown below, it includes only the Dairy product department.

Consider the following view. The Product Department dimension is placed on the Rows shelf and the Store Sales measure is placed on the Columns shelf.

If you place the Dairy set on the Filters shelf, you can see that the view is filtered to include only the Dairy product categories.

As shown below, you can drill down into Product Department to reveal the Product Category, Product Subcategory, and Brand Name levels. As these descendants are revealed, row headers are added to the view. This is because a set filter allows you to view the levels of detail contained within the filtered members.
