Create Territories on a Map
When you're analyzing data on a map view, you might want to group existing locations together to create your own territories or regions, such as sales territories for your organization.
In Tableau, there are several ways to create territories:
Option 1: Select and group locations on a map
If you have created a map view, you can select and group locations (marks) on the map to create your territories.
For example, the following map view shows the total sales by postcode for a company with sales across Australia.
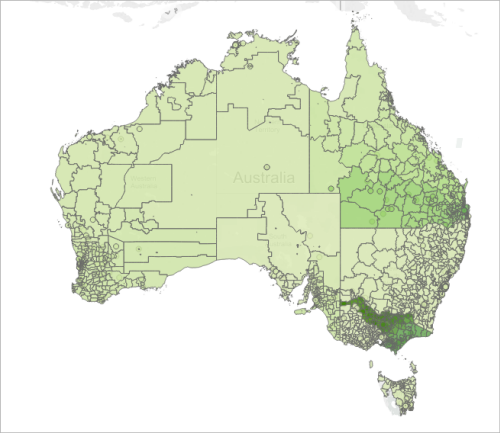
The first thing you might be thinking is: That's a lot of postcodes! In fact, there is a mark in this map view for every single 4-digit postcode in Australia, and each of those marks has an aggregation for SUM of Sales. If you're looking for sales information for every single postcode in Australia, than this is the view for you.
However, you might not want to analyze every individual location in your map view. Instead you might have your own areas, regions, or territories that you want to analyze as a whole. For example, maybe your organization splits Australia into five different sales territories, and you want to analyze the total sales for each of them.
In this case, because you've already created a map view, you can select locations directly on the map and group them to create your own territories. Follow the steps below to learn how.
Step 1: Select locations on the map to group into a territory
On the map view, select the locations (marks) that you want to group into your own territory. For more information about how to select marks, see Select marks(Link opens in a new window).
Step 2: Create the first group (your first territory)
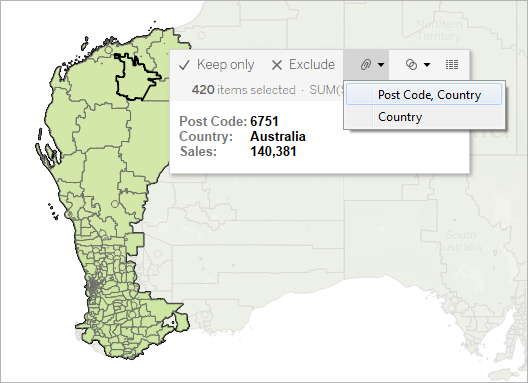
When you select marks in the view, or hover over a selection, a tooltip appears. On that tooltip, click the Group icon, and then select the level of detail you want to group the locations by.
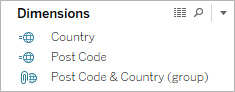
A new group field is added in the Data pane with a group icon next to it. To change the locations within the group at any time, right-click the group field in the Data pane and select Edit group.
The new field is also added to Color on the Marks card.
Notice that the marks you selected are now all the same color.
Step 3: Continue grouping data to add territories
Repeat steps 1 and 2 to create additional territories. Each territory is added as a group within the group field you created in step 2. You can create as many territories as you want.
Step 4: Add the group field to the view
From the Data pane, drag the newly created group field to Detail on the Marks card. Next, to make each territory appear as a single mark, you must also remove the related geographic field(s) from the view.
For example, if you grouped postcodes at the Post Code, Country level, you must remove the Post Code and Country fields from the view.
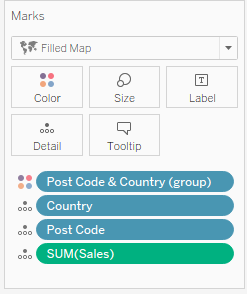
In the image below, notice that the Post Code and Country fields are no longer on Detail on the Marks card because they have been replaced by the Post Code & Country (group) field.
In this example, there are five groups within the Post Code & Country (group) field, so five territories appear on the map. Aggregations, such as SUM (Sales), are computed at the level of the territory, rather than separately for each location within the territory.
You can now see the SUM (Sales) for each territory by color. Territory 5 has the most sales.

Option 2: Create a territory from a geographic field
You can also create territories by creating groups in the Data pane.
-
In the Data pane, right-click a geographic field (such as City or State) and select Create > Group.
-
In the Create Group dialog box, select the locations you want in your first territory and click Group. Each group you create represents a territory.
-
Repeat step 2 until you've created all of your territories, and then click OK.
The new group field is added to the Data pane.
-
From the Data pane, drag the newly created group field to Detail on the Marks card.
You can also drag the field to Color or Label on the Marks card to help differentiate between each territory.
Change locations in your territory groups
If you want to change the locations in your territory groups at any time, right-click the group field in the Data pane and select Edit group.
Option 3: Geocode a territory field using another geographic field
If your data source already contains a custom territory field , you can quickly geocode it to make a map in Tableau using an existing geographic field in your data source.
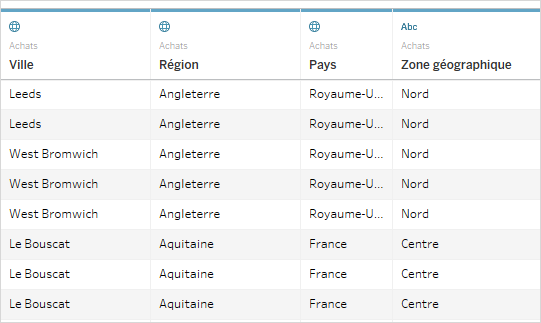
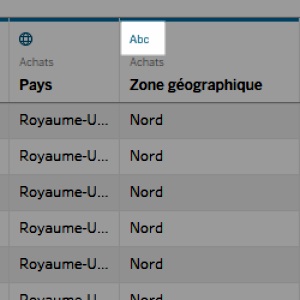
For example, the following data source contains a custom territory field for geographic areas called Zone geographique. It contains the values, North, Central and South.
If you were to bring this field into Tableau by itself, Tableau would not be able to recognize it as geographic data.
However, this data source also contains three geographic fields that Tableau does recognize: Country, Region, and City.
Each row in this data source contains a value for country, region, city and geographic zone. Therefore, each location is assigned a value from the custom territory field.
Because the Zone geographique field is included in the workbook with other geographic fields that contain locations that Tableau recognizes, you can geocode it at the level of detail of one of those fields.
Follow the steps below to geocode a territory field using another geographic field:
Step 1: Assign a geographic role to the territory field
On the data source page, click the data type icon for the custom territory field and select Geographic Role > Create from, and then select a level of detail to aggregate the field.
The options you see are based on the available geographic fields in your data source. Choose the level of aggregation you want in the view. If you're unsure how they will affect your view, try several different levels of detail. You can always undo and try again.
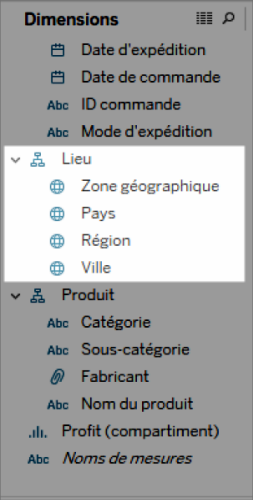
After you assign a geographic role to the territory field, it's added to its respective place in the location hierarchy. You can see it in the Data pane when you go to any worksheet.
Note: You can also click the data type icon next to the field in the Data pane to geocode a territory field using the above procedure.
Step 2: Add the territory field to the view
Create a map view and add the newly geocoded territory field to the Marks card. You can place it on Detail, Color, Label, or Tooltip. Note that fields on Detail determine the level of aggregation in the view.
The custom territory field functions similar to your other geographic fields.
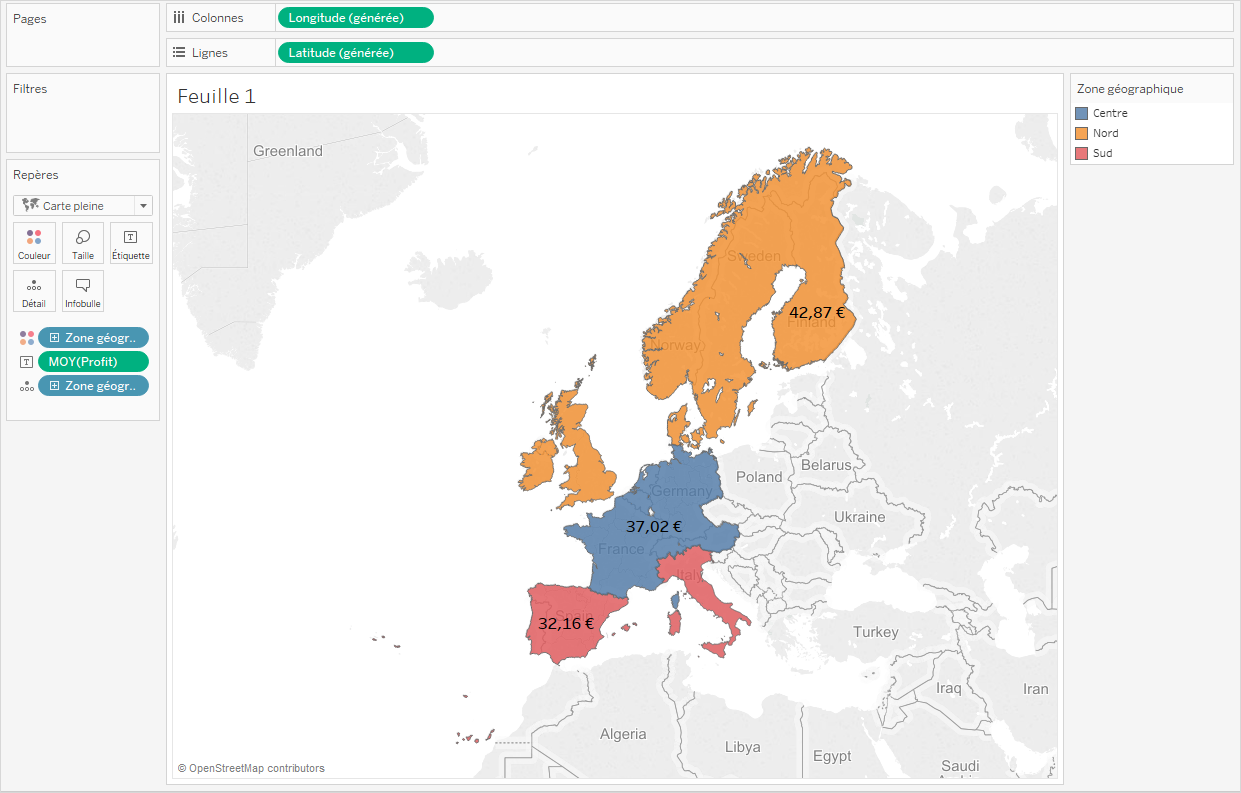
In the example below, the custom territory field (Zone geographique) is on Detail and Color on the Marks card. The average profit is shown for each territory (since the lowest level of detail is the territory field).
If you add another geographic field to Detail on the Marks card, such as the country field (Pays), the aggregation will update to show information for that level of detail.
Blend custom territory data
If your data source does not contain a territory field, you can blend a territory field with another geographic field in your data source. For more information, see Blend Geographic Data (Link opens in a new window). After you have blended your custom territory field with another field, follow the procedure in Step 1: Assign a geographic role to the custom territory field to geocode your territory field.