Query a Data Source
🕐 11 min read
- Anatomy of a query
- Return format
- Date formats
- Results handling and error checking
- Server-sent event support
Anatomy of a query
The JavaScript Object Notation (JSON) request body for the Query data source method has three components.
datasource: Required. This is an object that tells you which data source to query (a published data source or workbook data source) and, optionally, takes credentials. See The data source object.query: Required. This is how you specify which fields you want to retrieve information from. To get the names of the fields in your data source, see Get Data Source Information. For information about the structure of a query, see The query object.options: Optional. Options are metadata that you can use to adjust the behavior of the query. See The options object.
The following example shows the basic structure of a query.
{
"datasource": {
    "datasourceLuid": "",
 },
"options": {
    "debug": true
},
  "query": {
    "fields": [
       // fields here
    ]
  }
}
The data source object
The datasource object takes a datasourceLuid for published data sources, or a workbookDatasourceId for a workbook data source. To find the datasourceLuid, see Find the data source LUID.
{
"datasource": {
    "datasourceLuid": "1a2a3b4b-5c6c-7d8d-9e0e-1f2f3a4a5b6b",
 },
  "query": {
    "fields": [
       // fields here
    ]
  }
For a workbook data source, you must specify the workbookDatasourceId, and also include the session ID and the global session header (for Tableau Cloud) in the request headers. For instructions, see Find the workbook session ID and workbook data source ID.
{
"datasource": {
    "workbookDatasourceId": "federated.1a2b3c4d5e6f7g8h9i1j2k3l4m5n",
 },
  "query": { // See below for more details
    "fields": [
       // Fields here
    ]
  }
}
Data sources that require credentials
If you have a data source that requires credentials, enter them in an additional connection object.
{
"datasource": {
    "datasourceLuid": "2bac64a3-e216-4d8f-891c-905f9ce33ac3",
    "connections": [
        {
          "connectionLuid": "31752d0a-ec9d-11ee-9ad5-0a61dcca52fb",
          "connectionUsername": "test",
          "connectionPassword": "password"
        }
    ]
 },
  "query": { // See below for more details
    "fields": [
       // Fields here
    ]
  }
}
For data sources that require non-embedded credentials, add the following fields to your connection object in the body of the request.
connectionUsernameconnectionPassword
Data sources that require multiple credentials
If you have multiple connections that each require a username and password, add a list of connections. For each connection, you must provide a connectionLuid, a connectionUsername, and a connectionPassword.
To find the connectionLuid, use the Query Data Source Connections method. This method returns an ID for each connection on the specified data source. The value of your connection’s ID is the value to use for connectionLuid.
{
"datasource": {
    "datasourceLuid": "2bac64a3-e216-4d8f-891c-905f9ce33ac3",
    "connections": [
        {
          "connectionLuid": "31752d0a-ec9d-11ee-9ad5-0a61dcca52fb",
          "connectionUsername": "test",
          "connectionPassword": "password"
        },
        {
          "connectionLuid": "54ec51f6-7b1c-40d8-a55c-d4a70333c358",
          "connectionUsername": "test2",
          "connectionPassword": "password2"
        }
    ]
 },
  "query": { // See below for more details
    "fields": [
       // Fields here
    ]
  }
}
The query object
The query object contains these basic components:
fields: Required. This contains an array of fields that define the output of the query. See Fields.filters: Optional. This contains an array of filters to apply to the query. They can include fields that aren’t in the fields array. See Filters.parameters: Optional. Parameters enable dynamic, user-defined inputs to control and customize the results returned by the data source query. They can act as variables (like numbers, dates, booleans, or strings) that replace constant values in calculations, or they can act as filters. See Parameters.
Fields
You can list the fields that you want from your published data source and see the returned data. Fields come in multiple forms: dimensions, measures, or custom calculations. You can sort fields, alias fields, and have their decimal places formatted (if they’re a number).
Dimensions
Pass in a fieldCaption and get the data for that field as a dimension.
The following example shows sorting, which is optional.
"fields": [
        {
            "fieldCaption": "Category",
            "sortPriority": 1
        },
        {
            "fieldCaption": "Sub-Category",
            "sortPriority": 2,
            "sortDirection": "DESC"
        },
]
Fields with aggregations or measures
You can add an aggregation, or function, to a field to treat the field as a measure.
"fields": [
        {
            "fieldCaption": "Sales",
            "function": "SUM",
            "maxDecimalPlaces": 2
        }
]
VDS supports the following functions for aggregations:
SUMAVGMEDIANCOUNTCOUNTDMINMAXSTDEVVARCOLLECTYEARQUARTERMONTHWEEKDAYTRUNC_YEARTRUNC_QUARTERTRUNC_MONTHTRUNC_WEEKTRUNC_DAY
Custom calculations
To specify a new, custom calculation as a field, give it a fieldCaption and a string in Tableau calculation syntax. To query an existing calculation, use the preceding methods to query an existing field.
"fields": [
        {
            "fieldCaption": "Profit Margin",
            "calculation": "SUM([Profit])/SUM([Sales])"
        }
]
The following is a complete list of things that you can add to your field object.
fieldCaption: Required. A name for the column must be provided. Either a reference to a specific column in the data source or, in the case of a calculation, a user-supplied name for the calculation.fieldAlias: Optional. An alternate name to give the column in the output. This is only used in Object format output.function: Optional. Provide a Function for a Measure to generate an aggregation against that Field’s values. For example, providing the SUM Function will cause an aggregated SUM to be calculated for that Field. A Field cannot contain both a Function and a Calculation.calculation: Optional. Provide a Calculation to generate a new data Field based on that Calculation. The Calculation should contain a string based on the Tableau Calculated Field Syntax. Since this is a newly generated Field, you must give it its own uniquefieldCaption. A Field can’t contain both a Function and a Calculation.maxDecimalPlaces: Optional. The maximum number of decimal places in the returned value. Any trailing zeros (0s) will be dropped. ThemaxDecimalPlacesvalue must be greater or equal to 0.sortDirection: Optional. The direction of the sort, either ascending or descending.sortPriority: Optional. To enable sorting on a specific Field, provide asortPriorityfor that Field, and that Field will be sorted. ThesortPriorityprovides a ranking of how to sort Fields when multiple Fields are being sorted. The highest priority (lowest number) field is sorted first. If only one field is being sorted, then any value may be used for sortPriority. The value should be an integer and can be negative.
Additional rules about fields
- You must query at least one field.
- You can’t query the same field twice.
- You can’t have duplicate sort priorities.
Filters
You can also filter the fields you receive back from the data source. To specify a filter, you can create a field (like above) to operate on. This field doesn’t need to be in the list of original fields. There are different kinds of filters, each requiring a filterType and a field to filter on.
Set filters
You can include or exclude certain values from your dataset when showing results.
The following filter is used for dimensions. You must set the Boolean exclude and provide a list of values to either exclude (when exclude=true) or include (when exclude=false).
If you’ve created aliases for members in a set, you can use those aliases in the query. For example, suppose that you added “Home” as an alias for “Home Office.” You could use “Home” as the value in the filter.
"filters": [
    {
      "field": {
         "fieldCaption": "Segment"
      },
      "filterType": "SET",
      "values": [ "Home", "Consumer"],
      "exclude": false
    }
]
Note that the values array can’t be empty.
Quantitative filters
A quantitative filter operates on a field with an aggregation. The filter can specify a minimum, maximum, or range of values. The filter can also be used to handle both null and non-null values.
Quantitative filters must have quantitativeFilterType, which can be one of the following (with some rules):
MIN: The “min” value must be set.MAX: The “max” value must be set.RANGE: Both the “min” and “max” values must be set.ONLY_NULL: Show only null values in the return data set. That is, don’t include a “min” value or a “max” value.ONLY_NON_NULL: Show only non-null values. That is, don’t include a “min” value or a “max” value.
If you have type ONLY_NULL or ONLY_NON_NULL, you can’t have minimums and maximums specified.
If you have type MIN, MAX, or RANGE, you can also set the additional property includeNulls to true (it’s false by default) if you’d like to include nulls.
There are two types of quantitative filters, one for dates and one for numerical values.
Quantitative numerical filters
For measures, set the filterType to QUANTITATIVE_NUMERICAL.
// measure range example
"filters": [
  {
    "column": {
        "fieldCaption": "Sales",
        "function": "SUM"
    },
    "filterType": "QUANTITATIVE_NUMERICAL",
    "quantitativeFilterType": "MIN",
    "min": 10000
  }
]
Quantitative date filters
For dates, set the filterType to QUANTITATIVE_DATE.
The only difference here’s that, instead of specifying min and max, you can instead specify minDate and maxDate.
// date range example
"filters": [
  {
     "field": {
         "fieldCaption": "Order Date"
      },
    "filterType": "QUANTITATIVE_DATE",
    "quantitativeFilterType": "MAX",
    "maxDate": "2020-04-01"
  }
]
Relative date filter
A relative date filter is a way to specify a range of dates from a given anchor. If you don’t set an anchor, today’s date will be used by default.
You must also set the variables periodType and dateRangeType.
periodType can be one of the following values:
MINUTESHOURSDAYSWEEKSMONTHSQUARTERSYEARS
dateRangeType can be one of the following values:
LASTCURRENTNEXTLASTN(requires you to addrangeNfield)NEXTN(requires you to addrangeNfield)TODATE
See the following Tableau Filter[Order Date] dialog box to help understand what these dateRangeTypes mean.
![Filter [Order Date] page](../assets/filter-order-date.png)
LASTLASTNCURRENTNEXTNNEXTTODATE
Some examples
// January 1st, 2020 - March 1st, 2020
"filters": [
  {
    "filterType": "DATE",
    "field": {
    	"fieldCaption": "Order Date"
     },
    "periodType": "MONTHS",
    "dateRangeType": "NEXTN",
    "rangeN": 3,
    "anchorDate": "2020-01-01"
  }
]
// January 1st, 2020 - December 31st, 2020
"filters": [
  {
    "filterType": "DATE",
    "field": {
    	"fieldCaption": "Order Date"
     },
    "periodType": "YEARS",
    "dateRangeType": "CURRENT",
    "anchorDate": "2020-01-01"
  }
]
// All dates up to today's date (no anchor defaults to today)
"filters": [
  {
    "filterType": "DATE",
     "field": {
    	"fieldCaption": "Order Date"
     },
    "periodType": "YEARS",
    "dateRangeType": "TODATE,
  }
]
Requirement: You must have a periodType and a dateRangeType. If you specify a rangeN, then your dateRangeType must be lastN or nextN.
Top N filter
You can see top or bottom values of a given field by some aggregation.
A top N filter, or filterType: TOP, allows you to find the top N results of a given category. You must specify the following inputs:
fieldCaption: The same as other queries, this is the column on which you want to filter.fieldToMeasure: This is a filter column on which you’re finding the top or bottom results of.direction: EitherTOPorBOTTOMto show the highest or lowest results.howMany: An integer for how many results you would like to see.
See the following example, “Top 10 States with the highest Profit.”
"filters": [
  {
    "field": {
    	"fieldCaption": "State/Province"
     },
    "filterType": "TOP",
    "howMany": 10,
    "fieldToMeasure": {
      "fieldCaption": "Profit",
      "function": "SUM"
    },
    "direction": "TOP"
  }
]
Requirement: You must have howMany and fieldToMeasure.
Match filter
You can also provide substrings to conditionally match various filter types.
"filters": [
    {
      "field": {
    	"fieldCaption": "State/Province"
      },
      "filterType": "MATCH",
      "startsWith": "A",
      "endsWith": "a",
      "contains": "o",
      "exclude": false
    }
]
Requirement: You must have at least one of startsWith, endsWith, or contains.
Context filter
You can add a context filter and create a dependent filter on a quantitative filter or a top N filter, ideally to improve performance. You can add “context” as a boolean field to any filter to make it a context filter. For more information about Tableau context filters, see Use Context Filters.
"filters": [
    {
        "field": {
    	    "fieldCaption": "SubCategory"
        },
        "filterType": "TOP",
        "howMany": 10,
        "fieldToMeasure": {
            "fieldCaption": "Sales",
            "function": "SUM"
        },
       "direction": "TOP"
    },
    {
        "field": {
    	    "fieldCaption": "Category"
        },
        "filterType": "SET",
        "values": [ "Furniture"],
        "exclude": false,
        "context": true
    }
]
Some additional rules about filters
- Set Filters, Match Filters, and Relative Date Filters can’t have functions or calculations.
- You can’t have multiple filters for a single field.
Parameters
When you query data sources, you can include parameters in the query request payload to override existing default parameter values. You can use parameters in:
- Calculated fields: Parameters enable dynamic formulas using [Parameter Caption/Name] syntax, allowing users to create flexible calculations that respond to parameter value changes.
- Ad-hoc calculations: Parameters can be referenced in temporary calculations created directly and providing a quick way to test parameter-driven logic without creating formal calculated fields.
- Bins: Parameters can control bin sizes and ranges dynamically, allowing users to adjust data grouping intervals interactively without recreating bin fields.
Parameters with ad hoc calculations
Parameters can be used within ad hoc calculated fields to create dynamic calculations directly in the data source query. Ad-hoc calculations are temporary calculations that you create by adding a calculated field. This lets you test parameter-driven logic quickly. To use parameters in ad hoc calculations, reference them using the syntax [Parameter Caption/Name] within your calculation expression.
For example, you can create calculations like INT([Profit] / [Profit Bin Size]) * [Profit Bin Size] directly. This approach is particularly useful for testing parameter logic, experimenting with what-if scenarios, and rapid prototyping. For more information, see Ad Hoc Calculations.
"fields": [
	{
		"fieldCaption": "Binned Profit",
		"calculation": "INT([Profit] / [Profit Bin Size]) * [Profit Bin Size]"
	}
]
Bin with a hard-coded bin size
To query a bin on Sales with a static hard-coded bin size of 10:
"query": {
    "fields": [
        {
            "fieldCaption": "Sales",
            "function": "COUNT"
        },
       // bin size is hard coded as 10 on the published data source, no way to change it here
        {
            "fieldCaption": "Sales (bin)",
            "sortPriority": 1
        }
    ]
  }
The response:
{
    "data": [
        {
            "COUNT(Sales)": 1398,
            "Sales (bin)": 0
        },
        {
            "COUNT(Sales)": 1528,
            "Sales (bin)": 10
        },
        {
            "COUNT(Sales)": 858,
            "Sales (bin)": 20
        },
        {
            "COUNT(Sales)": 690,
            "Sales (bin)": 30
        },
        {
            "COUNT(Sales)": 492,
            "Sales (bin)": 40
        },
        {
            "COUNT(Sales)": 349,
            "Sales (bin)": 50
        },
        {
            "COUNT(Sales)": 337,
            "Sales (bin)": 60
        },
... etc. ...
    ]
}
Bin with a parameter bin size
This example queries Profit (bin). This bin has a dynamic bin size, which is a parameter. We know from our metadata request that the default value of the bin size is 200. In this example, we change the bin size to 50.
Note: Because of the rules around what Profit Bin Size can be (as seen in the metadata), the bin size can only be between 50 and 200 with a step size of 50. Eventually VDS throws an error if you try to pass in a value that is not allowed.
If you try the query without using a parameter:
"query": {
    "fields": [
        {
            "fieldCaption": "Profit",
            "function": "COUNT"
        },{
            "fieldCaption": "Profit (bin)", // default value of bin size is 200
            "sortPriority": 1
        }
    ]
  }
The response:
{
    "data": [
        {
            "COUNT(Profit)": 1,
            "Profit (bin)": -33
        },
        {
            "COUNT(Profit)": 1,
            "Profit (bin)": -20
        },
        {
            "COUNT(Profit)": 1,
            "Profit (bin)": -19
        },
        {
            "COUNT(Profit)": 1,
            "Profit (bin)": -17
        },
... etc. ...
    ]
}
The same query, but you have overridden the bin size to be a different value:
"query": {
    "fields": [
        {
            "fieldCaption": "Profit",
            "function": "COUNT"
        },{
            "fieldCaption": "Profit (bin)", // We are overriding bin size below
            "sortPriority": 1
        }
    ],
    "parameters": [
        {
            "parameterCaption": "Profit Bin Size",
            "value": 50 // Override value from 200 to 50
        }
    ]
  }
The response:
{
    "data": [
        {
            "COUNT(Profit)": 1,
            "Profit (bin)": -132
        },
        {
            "COUNT(Profit)": 1,
            "Profit (bin)": -77
        },
        {
            "COUNT(Profit)": 1,
            "Profit (bin)": -75
        },
        {
            "COUNT(Profit)": 1,
            "Profit (bin)": -68
        },
        {
            "COUNT(Profit)": 1,
            "Profit (bin)": -59
        },
... etc. ...
    ]
}
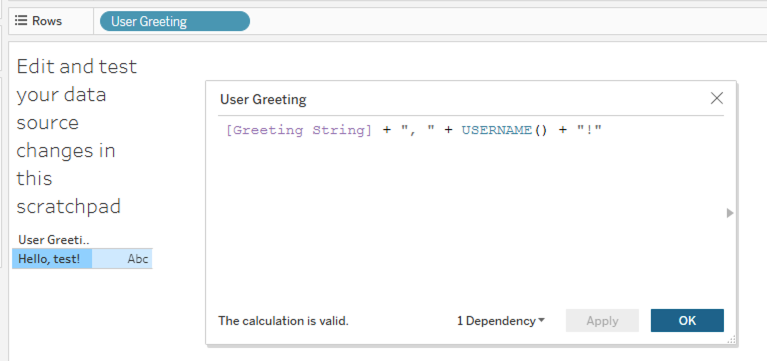
Calculated field with a parameter
This example queries a calculation that uses a parameter.
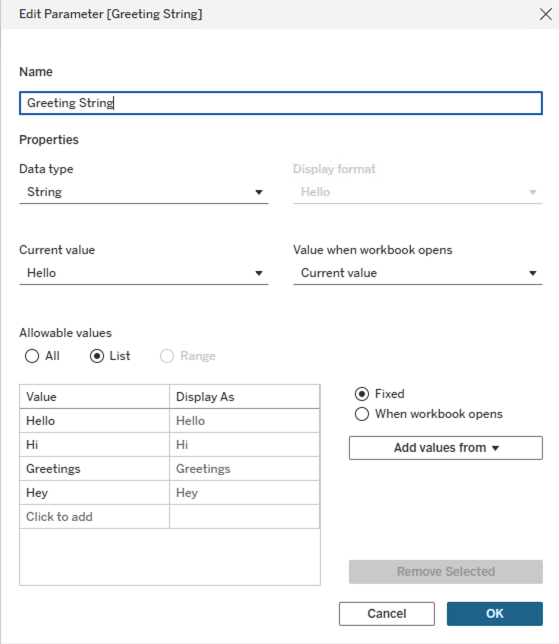
The following query doesn’t override the parameter:
"query": {
    "fields": [
        {
            "fieldCaption": "User Greeting"
        }
    ]
}
The return shows the default greeting:
{
    "data": [
        {
            "User Greeting": "Hello, test!"
        }
    ]
}
This next query uses a parameter to override the value of the Greeting String:
"query": {
    "fields": [
        {
            "fieldCaption": "User Greeting"
        }
    ],
    "parameters": [
        {
            "parameterCaption": "Greeting String",
            "value": "Hi" // Override default with "Hi"
        }
    ]
  }
The response shows the new value:
{
    "data": [
        {
            "User Greeting": "Hi, test!"
        }
    ]
}
Create a New bin
To make a new bin on a field, give the measure field and the bin size. VDS validates that the field you provide a bin on is a measure.
For example, this query:
"query": {
    "fields": [
        {
            "fieldCaption": "Discount", // Create a new bin on the field "Discount"
            "binSize": 0.1,
            "sortPriority": 1
        },
        {
            "fieldCaption": "Discount",
            "function": "COUNT"
        }
    ]

  }
returns:
{
    "data": [
        {
            "Discount (bin)": 0.0,
            "COUNT(Discount)": 4925
        },
        {
            "Discount (bin)": 0.1,
            "COUNT(Discount)": 148
        },
        {
            "Discount (bin)": 0.2,
            "COUNT(Discount)": 3936
        },
        {
            "Discount (bin)": 0.3,
            "COUNT(Discount)": 27
        },
... etc. ...
    ]
}
The options object
In addition to the datasource object and the query object, VDS lets you use the following additional options that can adjust the behavior of your query.
-
debug: (Boolean) Returns more detailed error messages from VDS in debug mode. -
bypassMetadataCache: Set totrueif either the published data source or the underlying database has changed within your current session. When set totrue, VizQL Data Service (VDS) refreshes the metadata. -
withNewSession: Set totrueto request a new session. Clears the cached session for the user before a new session is created. -
interpretFieldCaptionsAsFieldNames: (Boolean) When set totrue, you can use thefieldNamevalue everywhere thefieldCaptionis used. This includes query fields, filter fields, fields to measure in a Top filter, parameters, table calculations, on the fly calculations, and any other place where you can pass in afieldCaption. For example, if you set this field totrue, you could query forParameter 2instead ofProfit Bin Size. -
includeHiddenFields: When set totrue, the response shows hidden fields. -
includeGroupFormulas: When set totrue, the response shows group information for fields that are categorical bins. -
disaggregate: (Boolean) Determines whether to aggregate results. This is the equivalent of Tableau web authoring UI. For help, see Disaggregate Data. This is only available for Query data source. -
returnFormat: Whether the return format is OBJECTS (human-readable) or ARRAYS (compact). -
rowLimit: Restricts the number of rows returned in the results of a query. This option takes an integer value of>=1. Use this option to reduce the number of rows and eliminate some clutter. While this option limits the number of rows shown in results of the query, VDS still must retrieve all the results from the underlying database. This option won’t necessarily improve performance or provide faster results. -
returnServerSentEvents: When set totrue, the results are returned using the server-sent events (SSE) protocol. If not specified, or if the option is set tofalse, the results are streamed back as JSON. For more information, see Results handling and error checking and Server-sent event support.
Example query with options
{
"datasource": { // See above for more details
	// datasource info here
 },
"query": { // See above for more details
  "fields": [
       // Fields here
  ]
 },
"options": {
   "returnFormat": "OBJECTS",
   "debug": true,
   "disaggregate": false
}
}
Query using fieldName value
In the example of a calculation on the data source, the response shows both the fieldName and the fieldCaption:
{
    "data": [
        {
            "fieldName": "Calculation_1368249927221915648",
            "fieldCaption": "Profit Ratio",
            "dataType": "REAL",
            "defaultAggregation": "AGG",
            "columnClass": "CALCULATION",
            "formula": "SUM([Profit])/SUM([Sales])"
        }
    ]
}
If you set "interpretFieldCaptionsAsFieldNames": true,, you can use the fieldName value as the value for fieldCaption in your query. In this case, your query would use "fieldCaption":"Calculation_1368249927221915648".
Return format
VDS always returns the response body in JSON.
OBJECTS return vs. ARRAYS return option
The OBJECTS option returns field names as human-readable JSON objects. The ARRAYS option returns lists of data values.
// OBJECTS return
{
    "data": [
        {
            "Ship Mode": "Second Class",
            "SUM(Sales)": 466671.11140000017
        },
        {
            "Ship Mode": "Standard Class",
            "SUM(Sales)": 1378840.5509999855
        },
        {
            "Ship Mode": "Same Day",
            "SUM(Sales)": 129271.955
        },
        {
            "Ship Mode": "First Class",
            "SUM(Sales)": 351750.73690000066
        }
    ]
}

// ARRAYS return
{
    "data": [
        [
            "Second Class",
            466671.11140000017
        ],
        [
            "Standard Class",
            1378840.5509999855
        ],
        [
            "Same Day",
            129271.955
        ],
        [
            "First Class",
            351750.73690000066
        ]
    ]
}
Date formats
- VDS does not support datetimes. You can only use dates.
- VDS uses the RFC 3339 standard to input dates.
- VDS outputs dates and time in the RFC 3339 standard.
- VDS doesn’t support time zones in dates.
For more information, see the VizQL Data Service API documentation.
Results handling and error checking
Starting in Tableau 2026.1, the Query data source method streams results. Instead of waiting for the full query to complete and assembling the entire response first, as was previously the case, VDS begins returning results when they’re produced. This change typically improves the time that it takes to see results, and improves the overall query performance.
Starting in Tableau 2026.1, there’s no longer a 1-GB limit on the response size of a query. Because of this change, you could potentially get back a very large response. You should consider taking steps to handle this situation. In addition, the Query data source method has a 30-minute timeout. Queries that take longer than 30 minutes, even if they are in the process of returning results, cause a timeout error and cause the query to fail. The timeout error returns an HTTP status of 408, and VDS status of 408801.
Streaming and Error checking
Because the results are streamed, errors are returned differently depending on when they occur:
-
If an error occurs before any results are streamed, the response uses the normal REST pattern: a non-200 HTTP status code and a response body containing a
TableauErrorobject. For example, an invalid request is rejected, and the query is never run.Here’s an example of an error that occurred when there was an invalid query:
{ "errorCode": "400803", "message": "Unknown Field: Stae/Province.", "datetime": "2025-10-30T20:53:13.804356606Z" } -
If an error occurs after streaming response has started, the HTTP status code and headers have already been sent and can’t be changed. In this case, you might still receive HTTP 200 even though the query request failed. When the error occurs during streaming, the data stops being added, an
errorproperty is appended to the results, and the response is completed. Theerrorproperty contains aTableauErrorobject (which includes a VDS error code. The first three digits of the error code correspond to the HTTP status). Because an error can occur even when the HTTP status indicates success, check both the HTTP status code and whether anerrorproperty is present in the response body.Here’s an example that shows an error encountered as the results are streamed back:
{
  "data": [
    {
      "Category": "Furniture",
      "Sub-Category": "Bookcases",
      "Country/Region": "Canada",
      "Product Name": "Atlantic Metals Mobile 2-Shelf Bookcases, Custom Colors",
      "AVG(Sales)": 72.294
    },
    {
      "Category": "Furniture",
      "Sub-Category": "Bookcases",
      "Country/Region": "Canada",
      "Product Name": "Bush Westfield Collection Bookcases, Fully Assembled",
      "AVG(Sales)": 168.31
    }
  ],
  "error": {
    "errorCode": "500000",
    "datetime": "2025-10-30T22:30:08.054791Z",
    "debug": null
  }
}
Server-sent event support
Starting in Tableau 2026.1, VDS supports streaming the response using the standard Server Sent Events protocol.
To enable server-sent events (SSE), set the returnServerSentEvents option when you call the query data source method. The option takes a boolean value and is false by default. When the option is false, VDS streams the results to the client as JSON as described in Results handling and error checking. If true, VDS streams the results to the client using the server-sent events protocol (text/event-stream). From that protocol, VDS only uses the data property. Each data property encodes in JSON the SseResultStream as specified the VDS OpenAPI specification.
Here’s an example query request that sets the returnServerSentEvents option:
{
  "datasource": {
    "datasourceLuid": ""
  },
  "options": {
    "returnServerSentEvents": true
  },
  "query": {
        "fields": [
        {
        "fieldCaption": "State/Province",
        "sortDirection": "ASC",
        "sortPriority": 1
        }
    ]
  }
}
The first event sent in the SSE response is the METADATA event, which contains the number of rows that will be returned. This event is followed by a stream of DATA events. Each DATA event contains some rows from the total set of rows to be returned. If an error is encountered while streaming, an ERROR event is sent, which contains the TableauError object.
Here’s an example of a server sent events response:
[
  {
    "event": "METADATA",
    "data": {
      "rowCount": 59
    }
  },
  {
    "event": "DATA",
    "data": [
      { "State/Province": "Alabama" },
      { "State/Province": "Alberta" },
      { "State/Province": "Arizona" },
      { "State/Province": "Arkansas" },
      { "State/Province": "British Columbia" }
    ]
  },
  {
    "event": "DATA",
    "data": [
      { "State/Province": "California" },
      { "State/Province": "Colorado" },
      { "State/Province": "Connecticut" },
      { "State/Province": "Delaware" },
      { "State/Province": "District of Columbia" }
    ]
  }
]
SSE and error checking
Because the SSE results are streamed, errors are returned differently depending on when they occur:
-
If an error occurs before any results are streamed, the response uses the normal REST pattern: a non-200 HTTP status code and a response body containing a
TableauErrorobject. For example, an invalid request is rejected, and the query is never run.Here’s an example of an SSE response when an error occurs in the query request (before streaming):
{ "errorCode": "400803", "message": "Unknown Field: Stae/Province.", "datetime": "2025-10-30T20:54:18.796332568Z" } -
If an error occurs after streaming response has started, the HTTP status code and headers have already been sent and can’t be changed. In this case, you might still receive HTTP 200 even though the query request failed. When the error occurs during streaming, the data stops being added, an
errorproperty is added to the results, and the response is completed. Theerrorproperty contains aTableauErrorobject (which includes a VDS error code. The first three digits of the error code correspond to the HTTP status). Because an error can occur even when the HTTP status indicates success, check both the HTTP status code and whether anerrorproperty is present in the response body.The following example shows an SSE response when an error is encountered during streaming:
[
  {
    "event": "METADATA",
    "data": {
    "rowCount": 1921
    }
  },
  {
    "event": "DATA",
    "data": [
      {
        "Category": "Furniture",
        "Sub-Category": "Bookcases",
        "Country/Region": "Canada",
        "Product Name": "Atlantic Metals Mobile 2-Shelf Bookcases, Custom Colors",
        "AVG(Sales)": 72.294
      },
      {
        "Category": "Furniture",
        "Sub-Category": "Bookcases",
        "Country/Region": "Canada",
        "Product Name": "Bush Westfield Collection Bookcases, Fully Assembled",
        "AVG(Sales)": 168.31
      }
    ]
  },
  {
    "event": "ERROR",
    "data": {
      "errorCode": "500000",
      "datetime": "2025-10-30T22:33:15.3807749Z",
      "debug": null
    }
  }
]