
Tableau Agent in Dashboards (Beta)
Tableau Agent in Dashboards is a pilot or beta service that is subject to the Beta Services Terms at Agreements - Salesforce.com(Link opens in a new window) or a written Unified Pilot Agreement if executed by Customer, and the Non-GA Gen AI, Non-GA Open AI LLM Provider, and Non-GA Multiple Infrastructure terms in the Product Terms Directory(Link opens in a new window). Use of this pilot or beta service consumes Customer Data Cloud Credits as applicable and use is at the Customer's sole discretion.
Note: Tableau Agent in Dashboards is available in Tableau Server version 2026.3 and later. If you are connecting to your LLM provider using a custom gateway with OAuth authentication, Tableau Agent in Dashboards isn’t supported. For more information, see Turn on AI in our Tableau Server Site(Link opens in a new window).
As a data analyst, you work hard to put together dashboards for business users to help them find data insights fast to take action on the things that matter most. However, it can take time for these consumers to find the right insights, go through the dashboard to find the right data to focus on, or even know if this dashboard is meant for them.
In addition, they might have questions or want to dive deeper to understand certain data points. This can result in additional work for you, the author.
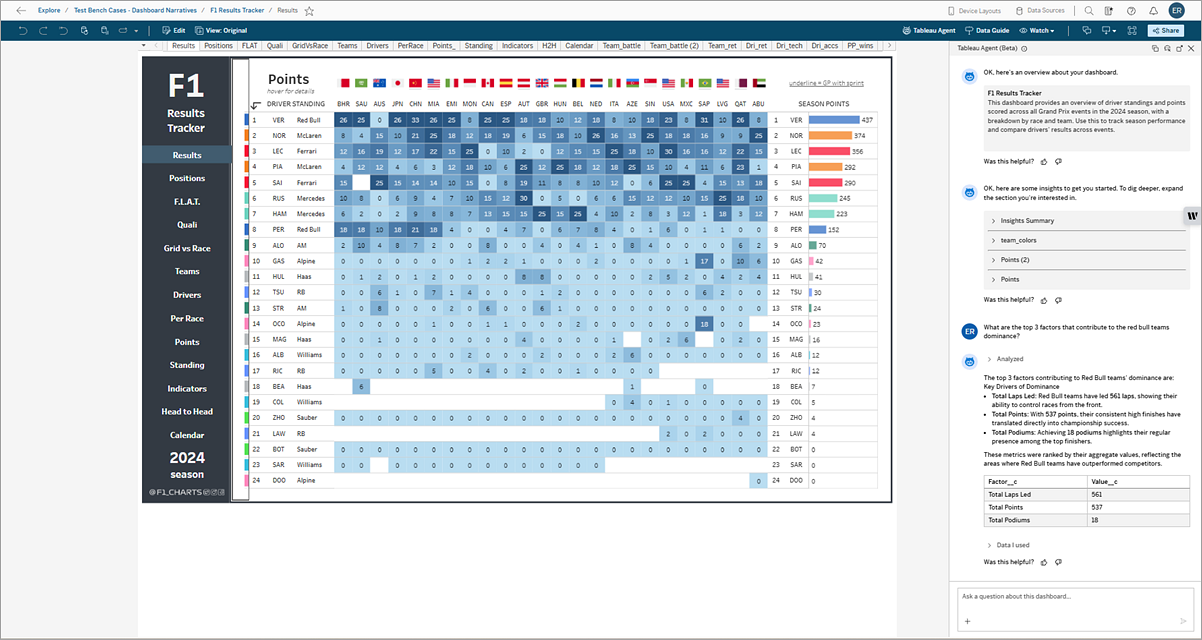
Meet Tableau Agent in Dashboards, an AI assistant for your dashboard consumers. Tableau Agent can provide an overview about the data in a dashboard and quickly get relevant insights with the simple click of a button. Users can also ask deep dive questions about the underlying data by simply typing their question into a text box using natural language.
Tableau Agent can't help you build a dashboard. But it can serve up a short summary about the dashboard, insights by chart, and answer questions with text and tables.
What's included
Tableau Agent in Dashboards includes 3 capabilities:
-
Dashboard Overview
-
Dashboard Insights
-
Dashboard Q&A
All of these features keep your security in mind by strictly adhering to all of your existing Tableau permissions, access controls, and row-level security. Users will only be able to access the data that you want them to see. To fully use all of these capabilities, users must be assigned the AI Access and Full Data Query permissions. For more information, see Prerequisites.
Dashboard Overview
Supported in Tableau Cloud (with Tableau Cloud+ or Tableau+) and Tableau Server version 2026.3 and later (with Tableau Server+)
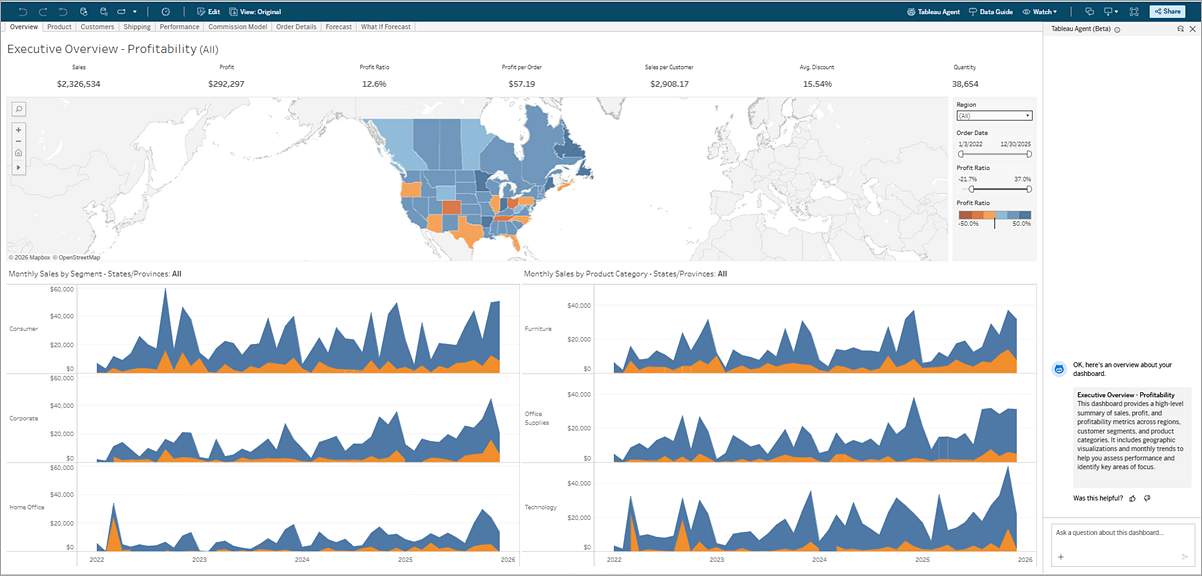
Dashboard Overview scans the visualizations in a dashboard and returns a summary to tell the viewer what the dashboard is about. This helps dashboard consumers get context about the dashboard, helps them on-board quickly and know that the dashboard is for them.
As a dashboard author, you can turn this capability on or off per dashboard. The option to configure Tableau Agent in Dashboards capabilities is available in Tableau Desktop and on the web in Tableau Cloud and Tableau Server.
Dashboard Insights
Supported in Tableau Cloud (with Tableau Cloud+ or Tableau+) and Tableau Server version 2026.3 and later (with Tableau Server+)
Dashboard Insights creates a set of summary insights based on the vizzes in the dashboard. It doesn't access or include any unused fields in your data source in the insights it creates. With Dashboard Insights, dashboard consumers can quickly focus on the insights that matter most, viz by viz.
As an author, you can turn Dashboard Narratives on or off for consumers on a per-dashboard basis. You can also configure the dashboard narrative to include or exclude certain worksheets, or focus on only certain types of insights.
The option to configure Tableau Agent in Dashboards capabilities is available in Tableau Desktop and on the web in Tableau Cloud and Tableau Server.
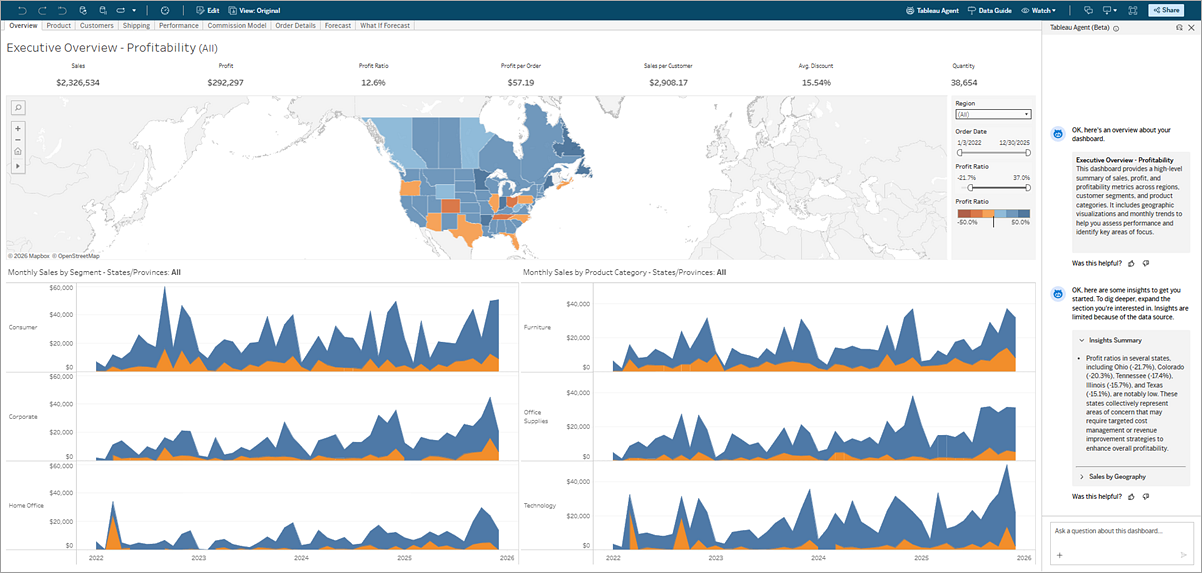
Tableau Agent can create the following types of insights:
Note: Dashboard Insights works best with published data sources. If your dashboard uses a local data source, then only Unexpected Values (outliers) are returned
| Insight type | Definition |
| Concentrated Contribution | Shows when a small number of dimension members make up a majority (50% or more) of the contribution to a metric. |
| Top Drivers | Shows values for dimension members that changed the most in the same direction as the observed change in the metric. |
| Current Trend | Shows current trends to communicate the rate of change, direction, and fluctuations for the metric value. |
| Trend Change | Shows new trends that vary significantly from the current trend. This insight communicates the rate of change, direction, and fluctuations for the metric value. |
| Bottom Contributors | Shows the lowest values in a dimension for a metric within a given time range. |
| Top Detractors | Shows values for dimension members that changed the most in the opposite direction to the observed change in the metric. |
| Unexpected Values (outliers) | Shows when the value of a metric for a given time range is higher or lower than the expected range based on historic observations of the metric. |
Dashboard Q&A
Supported in Tableau Cloud (with Tableau Cloud+ or Tableau+) and Tableau Server version 2026.3 and later (with Tableau Server+)
When you have a question about your dashboard or just want to dive deeper into the data, Dashboard Q&A is the answer. With the appropriate permissions, even Viewers can type in a question about their data and Tableau Agent will query the underlying data source.
With Dashboard Q&A, you can ask "What" and "Why" questions using natural language. For example "What California facilities classified as urgent care have an average wait time of > 90 minutes?". "Why does "Customer A" have a large negative profit?".
Tableau Agent can answer these questions using the workbook's data source, whether published or embedded.
Tableau Agent can respond with text and tables, or even a viz, and you can dig deeper into the response to see how it came up with the answer. Dashboard Q&A shows all of the reasoning steps that Tableau Agent took to find its answer, as well as a summary of the data it used, so you can be confident that the response is accurate.
As a dashboard author, you can turn this capability on or off per dashboard. The option to configure Tableau Agent in Dashboards capabilities is available in Tableau Desktop and on the web in Tableau Cloud and Tableau Server.
You can also improve the response quality for Tableau Agent by uploading business preferences for your organization such as how your business uses specific data, or distinct terminology for your business. Uploading Business Preferences is currently only supported in Tableau Cloud.
Additionally, if your organization uses Tableau Knowledge, Tableau Agent in Dashboard Q&A connects directly to your knowledge graph. It evaluates global business preferences defined across the graph to guide its answers, while automatically ingesting any workbook-level business preferences you upload. For more information, see Improve response quality for Dashboard Q&A(Link opens in a new window) and About Tableau Knowledge(Link opens in a new window).
Note: Tableau Knowledge is currently supported in Tableau Cloud and isn’t available when connecting to Tableau Server.
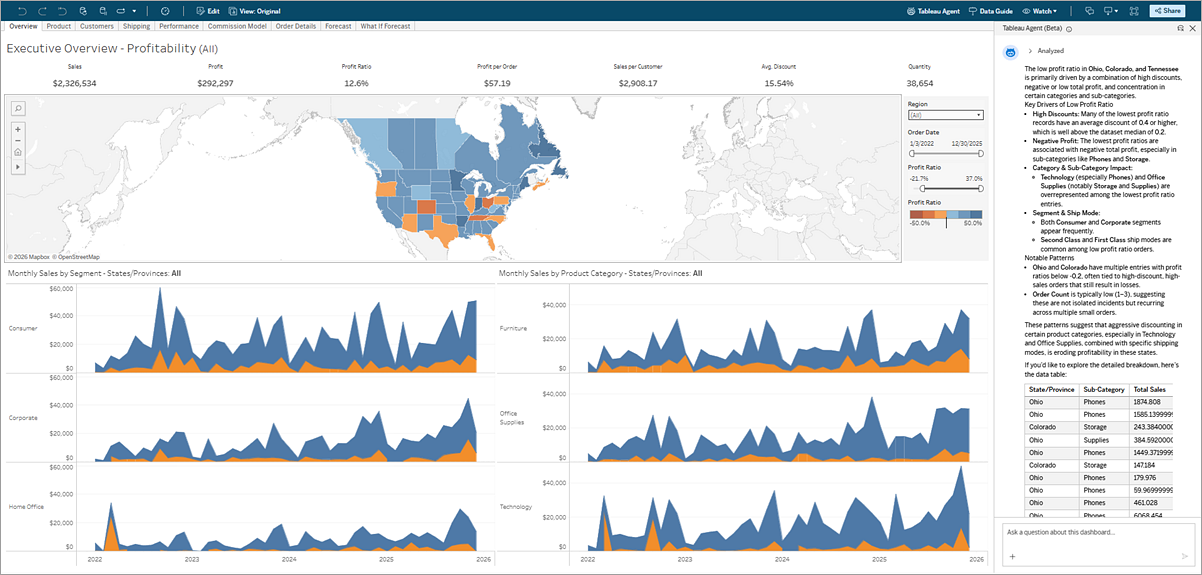
Tableau Agent and Trust
Applies to Tableau Cloud only
Tableau Agent is built on top of the Einstein Trust Layer(Link opens in a new window) and inherits all of its security, governance, and Trust capabilities. As you interact with Tableau Agent, any data that is sent to the Large Language Model (LLM) isn't saved to the LLM, and no customer data is ever used to train the model.
The Einstein Trust Layer can be used to mask Personally Identifying Information (PII) before it is sent to the LLM using pattern-based data masking. Using machine learning and pattern matching techniques, PII in prompts are replaced with generic tokens and then unmasked with original values in the response. For more information about how to configure data masking, see Select What Data to Mask(Link opens in a new window) in the Salesforce help. For an additional layer of protection, the Einstein Trust Layer guarantees that after the prompt and response are processed by the LLM, the LLM forgets both the prompt and the response.
Tableau Server (version 2026.3 and later)
AI in Tableau features when connected to Tableau Server don't go through the Einstein Trust Layer. Instead, your requests are sent directly to your own LLM provider, either directly or via a custom gateway. This includes PII masking for different languages. You're responsible for ensuring that their service and your agreement can effectively detect and protect PII across the languages that Tableau Agent supports.
Tableau Agent billing considerations
Note: Starting October 2025, AI in Tableau no longer consumes Einstein Request credits for AI usage. Other services, such as Data 360 services, can still consume other types of credits. Data 360 credits include Data Service credits and Flex credits. The type and number of credits consumed varies based on the credit model you have chosen for your Salesforce org. For more information, see Einstein Request & Flex Credit Rate Card Updates FAQ(Link opens in a new window) and Billing Considerations for Audit and Feedback(Link opens in a new window) in the Salesforce Help Center.
When you use generative AI features when connected to Tableau Cloud, it may consume Data 360 credits if you're using the Einstein data collection and Storage (also known as Audit Trail) feature as part of your AI in Tableau setup. For more information, see AI in Tableau Usage(Link opens in a new window).
You can view your credit consumption in your Salesforce org using pre-built dashboards and Digital Wallet, or connect to your Data 360 data from Tableau and build visualizations using the data from Digital Wallet tables. For more information, see View Credit Consumption(Link opens in a new window).
When connecting to Tableau Agent in Tableau Server, you'll use your own LLM provider instance. Because your data is flowing through this dedicated connection, your requests don't go through the Einstein Trust Layer or incur any associated billing. Your usage will be billed directly, according to your specific LLM provider agreement.
Prerequisites
Before you can use Tableau Agent in Tableau Dashboards complete the following prerequisites:
-
Connect to a Tableau Cloud+, Tableau+ Cloud site, Tableau Cloud trial site, or Tableau Server (version 2026.3 and later) with Server+.
-
(Admin) Ensure the AI in Tableau site setting for Tableau Agent in Dashboards is turned on. For more information, see Turn On AI in Your Tableau Cloud Site(Link opens in a new window)
-
(Admin, project leader, or content owner) Grant the workbook permissions AI Access and Full Data Query for your dashboard users. For more information see Permissions(Link opens in a new window) or Turn on AI in Your Tableau Server Site(Link opens in a new window).
-
(Author) Use the Tableau Agent Best Practices checklist(Link opens in a new window) to make sure your data source, workbooks, and dashboard are optimized for Tableau Agent.
-
(Author) Create a Business Preferences .txt or .md file to help Tableau Agent better understand your business data, practices and terminology. For more information, see Improve response quality for Dashboard Q&A(Link opens in a new window).
Who can do this
Your site role will affect what you can do with Tableau Agent in dashboards.
- Creator and Site Administrator Creator: See and use Tableau Agent in Dashboards in authoring and viewing mode. Configure settings in authoring mode.
- Explorer (can publish) and Site Administrator Explorer: See and use Tableau Agent in Dashboards in authoring and viewing mode. Configure settings in authoring mode.
- Explorer: See and use Tableau Agent in Dashboards in viewing mode.
- Viewer: See and use Tableau Agent in Dashboards in viewing mode. AI Access and The Full Data Query workbook permission are required.