Create Dashboard Narratives with Tableau Agent (Beta)
As of October 14, 2025, Data Cloud has been rebranded to Data 360. During this transition, you may see references to Data Cloud in our application and documentation. While the name is new, the functionality and content remains unchanged.
Agent Dashboard Insights is a pilot or beta service that is subject to the Beta Services Terms at Agreements - Salesforce.com(Link opens in a new window) or a written Unified Pilot Agreement if executed by Customer, and the Non-GA Gen AI, Non-GA Open AI LLM Provider, and Non-GA Multiple Infrastructure terms in the Product Terms Directory(Link opens in a new window). Use of this pilot or beta service consumes Customer Data Cloud Credits as applicable and use is at the Customer's sole discretion.
As a data analyst, you work hard to put together dashboards for business users to find data insights fast so that they can take action on the things that matter most. However, sometimes it can take time for these consumers to find the right insights, go through the dashboard to find the right data to focus on, or even know if this dashboard is meant for them.
Meet Tableau Agent for Dashboard Narratives, your new AI assistant for dashboards. Now, Tableau Agent can look at your dashboards and quickly give a summary to tell dashboard consumers what the dashboard is about.
It can also create a set of summary insights based on the charts in the dashboard. As a consumer, you can quickly focus on the insights that matter most to you, chart by chart.
As an author, you can turn Dashboard Narratives on or off for consumers on a per-dashboard basis. You can also configure the dashboard narrative to include or exclude certain worksheets, or focus on only certain types of insights.
Note: To use this feature, you must be signed into a Tableau Cloud site with Tableau+ or using a Tableau Cloud Trial site. In addition, a site administrator must opt into the Beta and turn on Dashboard Narratives for your site. For more information, see Turn On AI in Your Tableau Cloud Site(Link opens in a new window).
Tableau Agent and Trust
Tableau Agent is built on top of the Einstein Trust Layer(Link opens in a new window) and inherits all of its security, governance, and Trust capabilities. As you interact with Tableau Agent, any data that is sent to the Large Language Model (LLM) isn’t saved to the LLM, and no customer data is ever used to train the model.
The Einstein Trust Layer can be used to mask Personally Identifying Information (PII) before it is sent to the LLM using pattern-based data masking. Using machine learning and pattern matching techniques, PII in prompts are replaced with generic tokens and then unmasked with original values in the response. For more information about how to configure data masking, see Select What Data to Mask(Link opens in a new window) in the Salesforce help. For an additional layer of protection, the Einstein Trust Layer guarantees that after the prompt and response are processed by the LLM, the LLM forgets both the prompt and the response.
Get Started with Dashboard Narratives
Tableau Agent for Dashboard Narratives is available in a side pane of a dashboard in a Tableau Cloud site or in Tableau Desktop (version 2026.1 and later) when signed in to a Tableau Cloud site. The Tableau Cloud site must have Tableau+ and AI in Tableau turned on for Dashboard Narratives. Dashboard Narratives is also available in Tableau Cloud Trial sites. For more information, see Turn On AI in Your Tableau Cloud Site(Link opens in a new window).
On dashboards, you interact with Tableau Agent using clickable buttons, not by typing questions in a text box.
Tableau Agent can review visualizations in a dashboard and write a summary about the dashboard. It can also find patterns, trends, relationships, and outliers in the charts and return a set of summary insights. This helps your dashboard consumers understand what the dashboard is about and then spot areas that need their attention.
Note: Tableau Agent only has access to the data that’s used in the dashboard (what’s available when you download the dashboard). Any unused fields in your data source aren't accessible by Tableau Agent and aren’t included in the insights it creates.
Dashboard consumers
To access Dashboard Narratives as a user consuming a dashboard, the following must be true.
- You must be signed into a Tableau Cloud site with Tableau+ and Dashboard Narratives turned on.
- The dashboard author must have turned on Dashboard Overview or Dashboard Insights for the dashboard you're viewing. The dashboard author can turn on either one or both of these options. What they’ve selected will determine the options that you can see.
- The dashboard must use a published data source, not a data source that is local to the dashboard (embedded).
- The dashboard must include at least one visualization. Dashboard Narratives isn’t available for worksheets or stories.
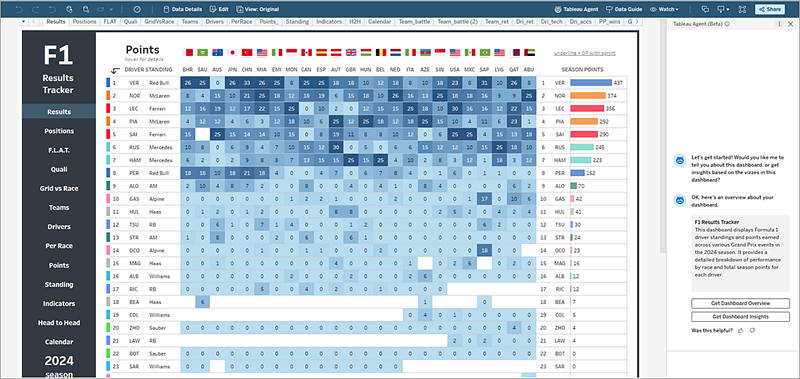
Dashboard Overview
The Dashboard Overview aspect of Tableau Agent helps a user understand what the dashboard is about. At its core, this feature answers the question "is this dashboard what I need for my analytical question?". In general, this feature is more useful for new users to a dashboard, or those looking for a high-level summary about what it contains. The summary may change whenever the underlying data refreshes.
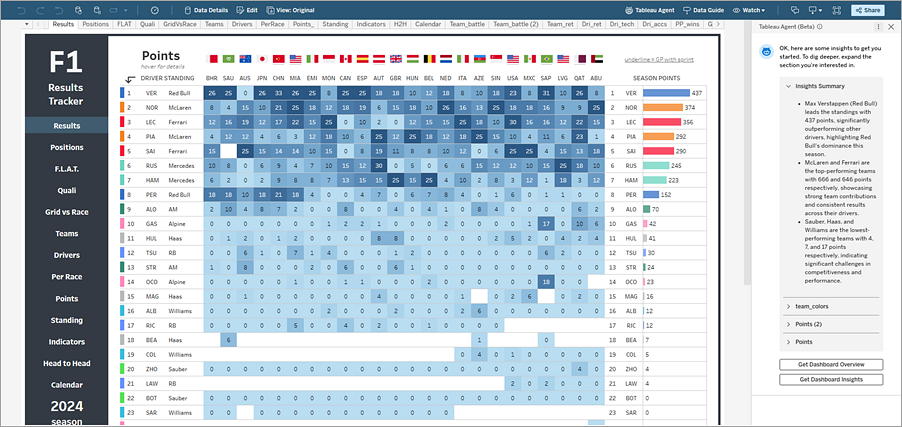
Dashboard Insights
The Dashboard Insights aspect of Tableau Agent helps a user understand the analysis on a dashboard. This feature looks at the specific vizzes in the dashboard and provides natural language insights from the data. Dashboard Insights is useful for those looking for a deeper understanding of the analytical story in the dashboard. Insights may change whenever the underlying data refreshes.
Dashboard authors
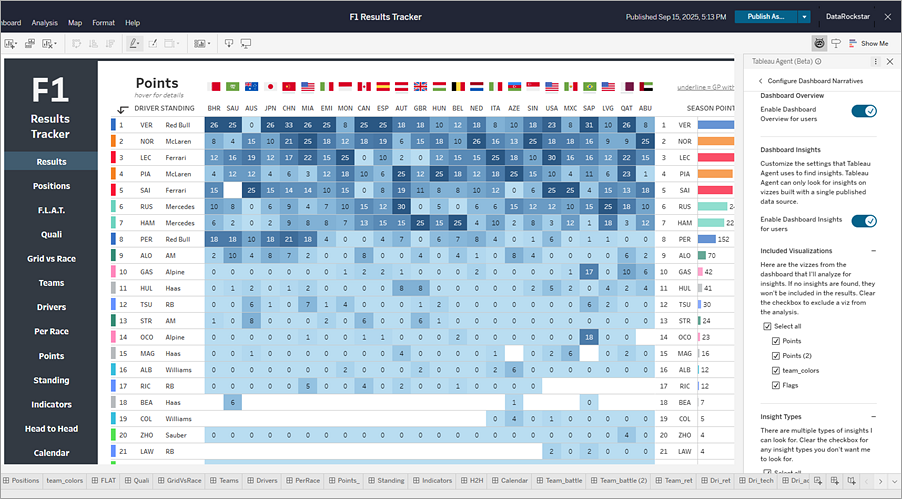
As a dashboard author, Dashboard Narratives must be used on an existing dashboard, it can't help you build a dashboard. To access Dashboard Narratives, navigate to a dashboard tab in the authoring environment of a workbook and click the Tableau Agent icon in the toolbar. This opens the pane. Accept the disclaimer to continue to the Dashboard Narrative.
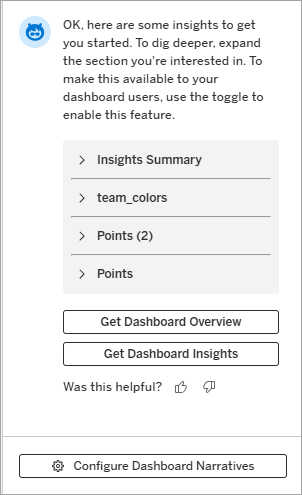
With the Tableau Agent pane open on a dashboard, you have two options: you can click a button to see the dashboard overview or insights, or you can configure Dashboard Insights.
Configure Insight Settings
To modify the default settings for Dashboard Insights, click Configure Dashboard Narratives at the bottom of the pane. This opens Configure Insights in the pane.
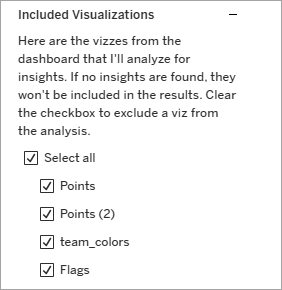
Worksheets
The Included Visualizations area lists all the worksheets in the dashboard. Clear the check box for any vizzes you don't want the Dashboard Insights feature to consider.
Insight Types
Tableau Agent supports a number of insight types. Outliers will always be assessed. If Tableau Pulse is enabled in the Tableau Cloud site, additional insight types will be available. Not all insight types will be evaluated for all vizzes. For example time comparisons won't be available unless there's a continuous date dimension present.
The Insight Types area lists what descriptive analysis Tableau Agent looks for in each viz. If you don't want a specific insight to be included in the output, clear the check box for that insight type. Clearing a check box prevents that insight type from being assessed for the entire dashboard. You can't configure insight types for a specific viz.
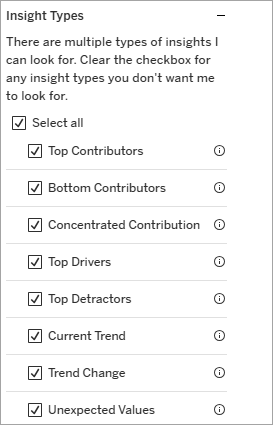
For more details on what each insight type does, click the information icon in the UI or see the section Insight types supported by Dashboard Narratives.
Test narrative output
As a dashboard author, you can use Dashboard Narratives for your dashboards while in the authoring environment. This can be useful to verify that a dashboard presents the analysis you expect and has a clear data story.
It's also important to test the output if you plan to turn this feature on for your consumers to ensure everything looks as it should.
Turn on Dashboard Narratives for consumers
To allow your dashboard users to access Dashboard Narrative features, you must enable them for consumers. This makes the Tableau Agent pane available on the published version of the dashboard. Users must still click the Get Dashboard Overview or Get Dashboard Insights buttons for Tableau Agent to run and return the corresponding results.
Insight types supported by Dashboard Narratives
If Tableau Pulse is turned on in your environment, Tableau Agent can look for the following insights.
| Insight type | Definition |
| Concentrated Contribution | Shows when a small number of dimension members make up a majority (50% or more) of the contribution to a metric. |
| Top Drivers | Shows values for dimension members that changed the most in the same direction as the observed change in the metric. |
| Current Trend | Shows current trends to communicate the rate of change, direction, and fluctuations for the metric value. |
| Trend Change | Shows new trends that vary significantly from the current trend. This insight communicates the rate of change, direction, and fluctuations for the metric value. |
| Bottom Contributors | Shows the lowest values in a dimension for a metric within a given time range. |
| Top Detractors | Shows values for dimension members that changed the most in the opposite direction to the observed change in the metric. |
| Unexpected Values | Shows when the value of a metric for a given time range is higher or lower than the expected range based on historic observations of the metric. |
As a dashboard author, if you don’t want Tableau Agent to look for a particular insight type, clear the check box next to that insight type. For more information about Tableau Pulse insight types, see Insight types in Tableau Pulse(Link opens in a new window).
Tips for getting the best results for Dashboard Narratives
- Avoid overly complex dashboards. A simple grid design is best. For example, if there are a lot of overlapping floating objects, Tableau Agent may not be able to effectively understand your dashboard layout.
- Give all vizzes a title. Tableau Agent will do its best to interpret what it sees, but it’s better to be explicit.
- Charts built with manipulations of the underlying data may send misleading information to the LLM. To reduce the impact on dashboard consumers, consider not including charts that are built with chart-specific modifications to the data.
- For example, waterfall charts are constructed using a Gantt mark type with a negative measure to make the bar the correct length. The LLM receives the negative measure and will therefore misconstrue the direction of the mark.
Be the human in the loop
As with all AI, it's important to review the results you get when using Tableau Agent. Tableau Agent does its best to understand your data, but it might not always get it right. When reviewing insights, always check the output for accuracy. Remember, you know your data best.
If Tableau Agent gets something wrong, you can try getting insights again. You can also provide feedback at any time on the results with the thumbs up or thumbs down buttons that show up with every Tableau Agent response.
Who can do this
You must be connected to a Tableau+ Cloud site or Tableau Cloud trial site with the AI in Tableau Dashboard Narratives site setting turned on. For more information, see Turn On AI in Your Tableau Cloud Site(Link opens in a new window). Your site role will affect what you can do with Tableau Agent in dashboards.
- Creator and Site Administrator Creator: See and use Dashboard Narratives in authoring and viewing mode. Configure Dashboard Narrative settings in authoring mode.
- Explorer (can publish) and Site Administrator Explorer: See and use Dashboard Narratives in authoring and viewing mode. Configure Dashboard Narrative settings in authoring mode.
- Explorer: See and use Dashboard Narratives in viewing mode.
- Viewer: See and use Dashboard Narratives in viewing mode.