Measurement of Tableau User Engagement and Adoption
This content is part of Tableau Blueprint—a maturity framework allowing you to zoom in and improve how your organization uses data to drive impact. To begin your journey, take our assessment(Link opens in a new window).
As Tableau is deployed broadly across your organization to users of all skill levels, administrators need to ensure that the content that is being created and consumed is discoverable, fresh, and relevant to your audiences. To accomplish this, administrators should measure the user engagement and adoption.
Measurement helps your deployment to operate at scale and evolve. It helps you understand user behaviors—who is creating and consuming content and the quality, the relevance of the dashboards and data sources being published, and the use of certified versus sandbox content. If content isn’t being consumed, you will be able to identify it and take the appropriate next steps to archive or delete it.
BEST PRACTICE RECOMMENDATION:
Combine the measurement of Tableau user engagement and adoption data with Tableau Monitoring data to shape new behaviors and accelerate towards your goal of becoming more data-driven by taking these insights into Internal Tableau Activities like admin, user, and champion group meetings.
For example, if you found a limited number of Published Data Sources and none of those have been certified, adding a session to your next user group meeting on identifying use cases, prioritizing publishing by audience size, and certifying data sources using your organization's best practices checklist will enable new data curation skills.
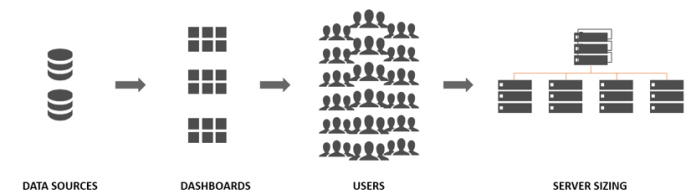
Understanding the relationship between data sources and workbook content, users, and system performance, scalability, and sizing is a reliable way to look into current usage and future growth. Open communication between Tableau Server Administrators and Tableau Site Administrators/Project Leaders or Tableau Cloud Site Administrators and Project Leaders is needed to plan for new users and use cases on the platform. Consider this:
- A team or group of users has a known collection of sources of data that can be identified and prepared for them as Published Data Sources or embedded in workbooks.
- Published Data Sources, as well as embedded data sources, are used to populate dashboards.
- Dashboards have a specific audience, or group of users who should view them.
- For Tableau Server specifically, user engagement drives server scalability and sizing decisions to define hardware requirements, which are aligned with budget planning and procurement requests. Because Tableau Cloud is a hosted analytics solution, scaling is managed by Tableau.