Content Size and Performance
This content is part of Tableau Blueprint—a maturity framework allowing you to zoom in and improve how your organization uses data to drive impact. To begin your journey, take our assessment(Link opens in a new window).
Performance is a shared responsibility in Tableau Server and Tableau Cloud because of the cumulative effects of slow dashboards and long-running extract refreshes can have on the entire system. Based on performance thresholds you define, you should work with users to improve performance to expectations. The dashboards below can be found in the default administrative views on Tableau Server and Tableau Cloud. To access administrative views in Tableau Server or Tableau Cloud your site role must be set to either Server Administrator or Site Administrator Creator.
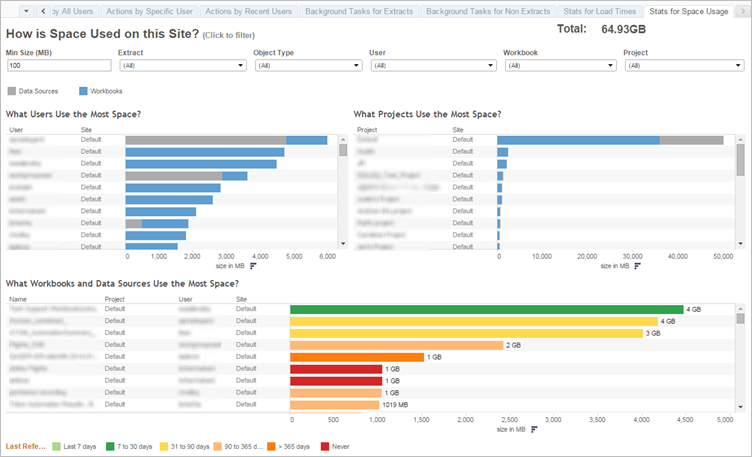
- What is the distribution of workbook and data source size? (Weekly)
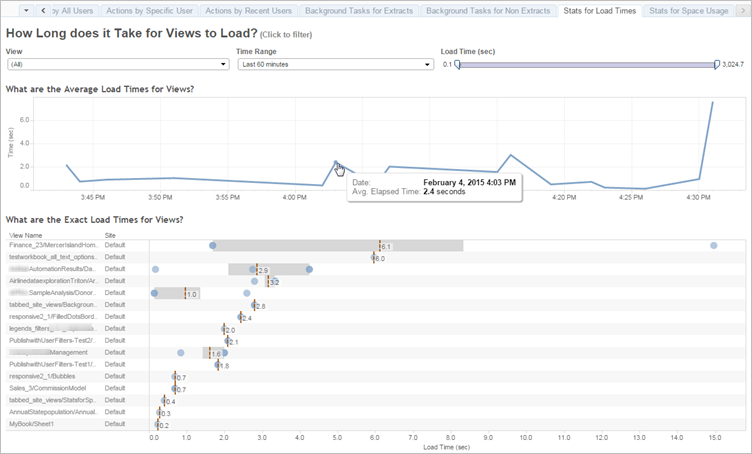
- Tableau Server only: How long does it take for views to load? (Weekly) — Have you set a load time expectation to identify when a workbook is loading too slowly? Do you have an exception procedure in place?
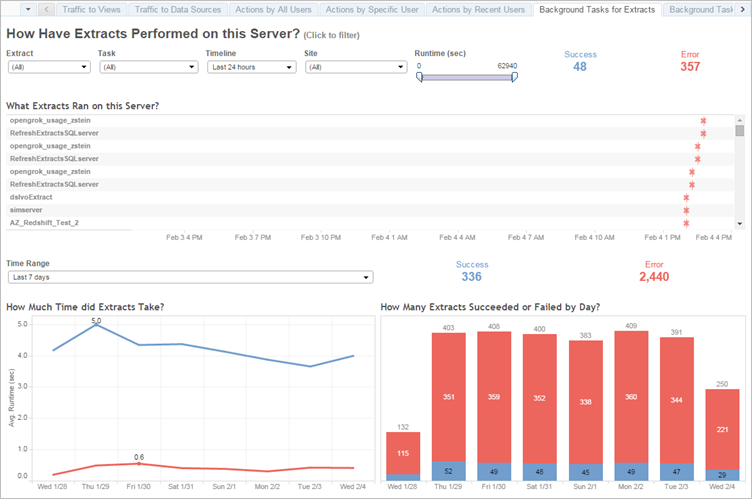
- How are extracts performing? (Weekly) — See the successes and failures of extracts and determine if you’re experiencing long extract refresh times.
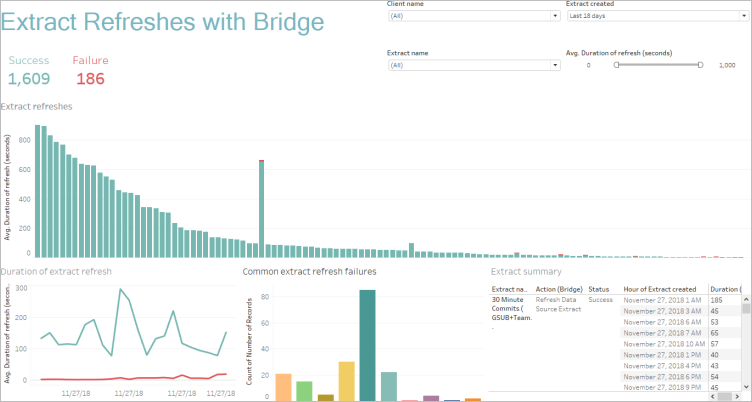
- Tableau Cloud only: How are Bridge clients performing? (Weekly)
- Are subscriptions delivered on time? (Weekly)
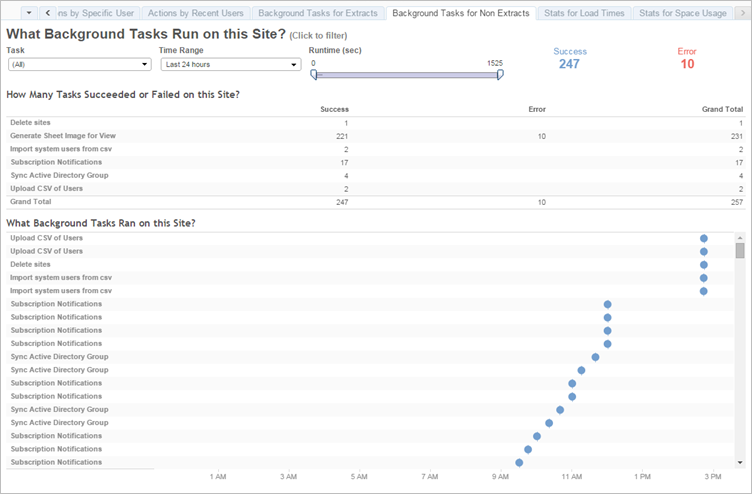
Tableau Accelerators
Tableau Accelerators are pre-built dashboards designed to help you get a jumpstart on your data analysis. Our collection of Accelerators includes two dashboards that administrators can use to improve dashboard load times at scale; read more on the Tableau blog.
Access the complete set of Accelerators on the Tableau Exchange and in Tableau Desktop. Additionally, select Accelerators are available to use when you create a workbook in Tableau Cloud.
