Tableau Content Utilization
This content is part of Tableau Blueprint—a maturity framework allowing you to zoom in and improve how your organization uses data to drive impact. To begin your journey, take our assessment(Link opens in a new window).
Utilization is the effective use of the data visualizations for business decisions but the complete picture cannot be told through Traffic to Views alone. When viewing this data, put it in the context of your expected audience size that was documented on the Use Cases tab of the Tableau Blueprint Planner. Tableau Server deployments will use the Tableau Server Repository to create custom views with Tableau Server Insights. Tableau Cloud Site Admins have access to curated data sources called Admin Insights.
For example, if a Published Data Source has an audience of 500 users who should use it at least once a day, then we would expect the Traffic to Views dashboard to show approximately 10,000 views in a month (20 business days * 500 users). Now, if 250 people view the dashboard 2 times a day, then you’re at 50% engagement and that’s your cue to understand whether the information is relevant, there is a skills gap, or half the audience doesn’t realize that such a dashboard that will help them do their job even exists.
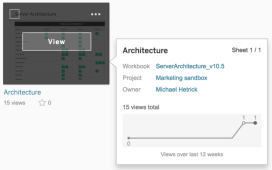
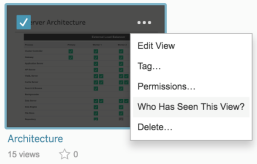
For content published to Tableau Server, individual content creators can see utilization for their content in the sparkline tooltip by hovering over the workbook’s thumbnail or selecting Who Has Seen This View from the menu. In Tableau Cloud, you can understand who has accessed a viz by using the TS Events Admin Insights data source. For more information about Tableau Cloud Admin Insights, see Explore the Data Sources.
Content Utilization
- Within a site or project, what is the view traffic? (Monthly) — Understanding the usage trend for a site and project will help you understand growth or whether additional community activities can educate users on available content. Below, you can see traffic in the project represented in red has dropped off dramatically, while the remaining colors at the bottom are flat. Use TS Events in both Tableau Server Insights and Tableau Cloud Admin Insights.

- What is view traffic in last 180 days vs 30 Days? (Monthly) — Low traffic views should be reviewed and archived based on activity threshold within a time period. If content is published but not viewed, it is consuming system resources and potentially making it harder for users to locate more relevant content. In the example below, only three dashboards (orange) have had been accessed in the last 30 days. Use TS Content in Tableau Server Insights. Note: Tableau Cloud Admin Insights includes 90 days of data. For Tableau Cloud, you should measure Views Accessed in Last 90 vs 30 days using TS Events.

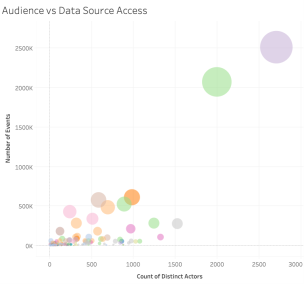
- What is a workbook’s audience size relative to access events? (Monthly) — When identifying use cases for new content, you should estimate the audience size for a particular workbook. By comparing the distinct count of consumers to the number of access events, you can understand the impact of content. Content in the lower left (low audience/low traffic) should be reviewed and removed if it is no longer useful. Use TS Events in both Tableau Server Insights and Tableau Cloud Admin Insights.

- What is a data source’s audience size relative to access events? (Monthly) — Similar to the previous example, when identifying use cases for new content, you should estimate the audience size for a particular data source. By comparing the distinct count of consumers to the number of access events, you can understand the impact of content. Content in the lower left (low audience/low traffic) should be reviewed and removed if it is no longer useful. Use TS Events in both Tableau Server Insights and Tableau Cloud Admin Insights.
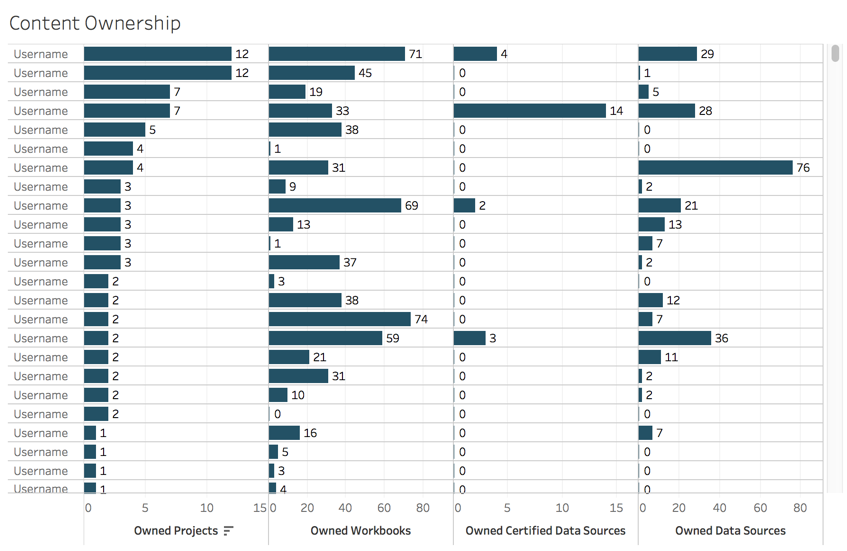
- Who is creating/owning content? (Monthly) — Users who create and share content are putting your organization’s modern analytics vision into practice. To understand who is publishing to Tableau, review project, workbook, and certified and uncertified data source owners. Use TS Users in both Tableau Server Insights and Tableau Cloud Admin Insights.