Tableau User Engagement
This content is part of Tableau Blueprint—a maturity framework allowing you to zoom in and improve how your organization uses data to drive impact. To begin your journey, take our assessment(Link opens in a new window).
Engagement is a measure of user behavior, both direct and indirect. Direct engagement includes viewing and interacting with a dashboard, connecting to a data source, and web authoring. Indirect engagement includes subscriptions and alerts that are delivered to a user. Tableau Server deployments will use the Tableau Server Repository to create custom views with Tableau Server Insights. Tableau Cloud Site Admins have access to curated data sources called Admin Insights.
Login Frequency
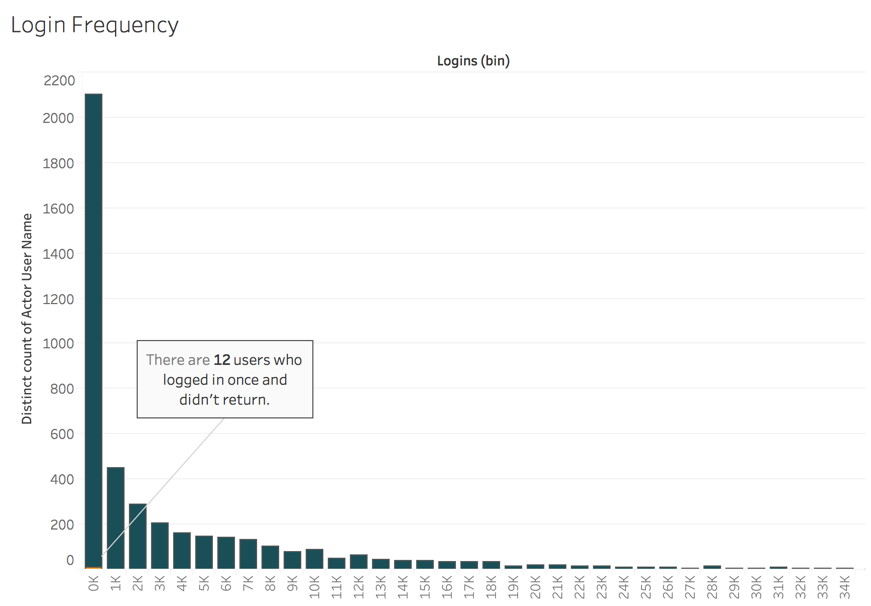
How many times have users logged in? (Monthly) — To measure user engagement, you should start by quantifying the number of logins, users who login once and didn't return, and users who never logged in. If twelve users have logged in once and didn't return, you should determine why. Use TS Events in both Tableau Server Insights and Tableau Cloud Admin Insights.
Days Since Last Login
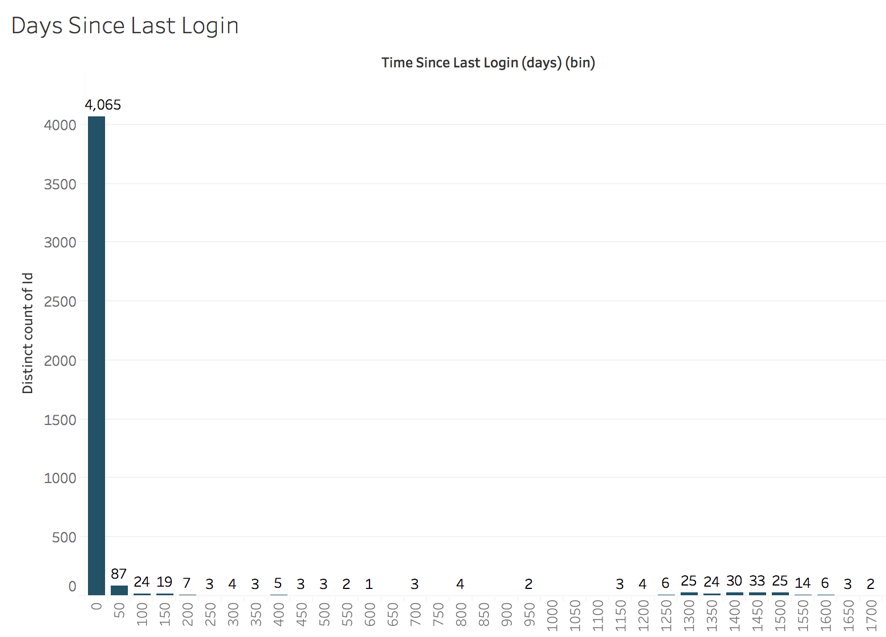
Is the use of content becoming habitual? (Monthly) — Quantifying the number of days since last login is a good indicator of whether users are in Tableau. For example, with 4,065 users logging in to Tableau from 0-49 days, use of Tableau is high. This can be especially useful if HR data is joined to view engagement within a department or team. Use TS Users in both Tableau Server Insights and Tableau Cloud Admin Insights.
Subscriptions & Alerts
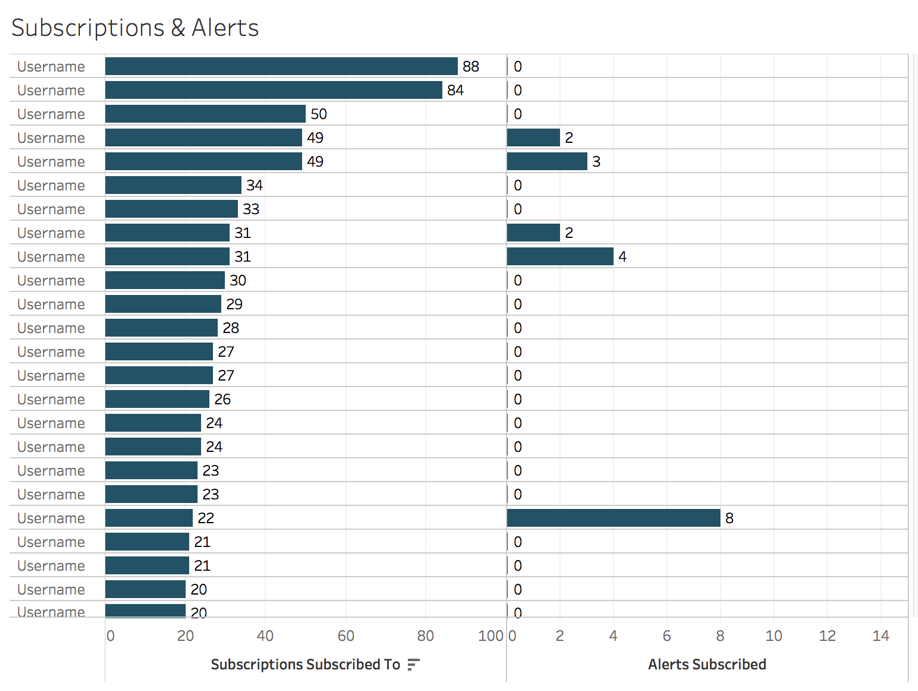
Are subscriptions and alerts being sent to users? (Monthly) — It's important to consider the direct (publish, view, and interact) and indirect (subscriptions and alerts) activity on Tableau. Even if users are not interacting directly with content, they may be receiving emails from subscriptions and alerts, and this can be quantified by filtering on the Send Subscription... and Send Data Driven Alert... events. Use TS Events in both Tableau Server Insights and Tableau Cloud Admin Insights.
Community Engagement
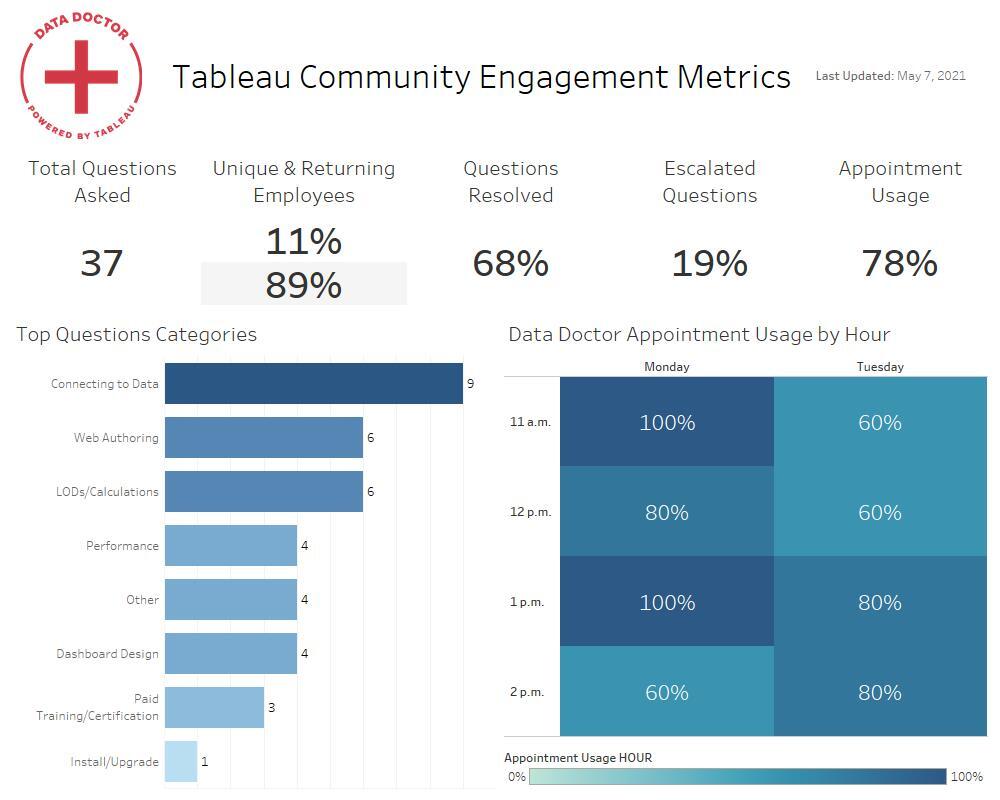
Are users finding the support they need? Quantifying user engagement data from your internal Tableau community can help surface recurring questions and overall adoption issues. In this example, we'll dive into measuring the impact of a Data Doctor program within an internal community.
Popular metrics include the number of Data Doctor appointments over a period of time and the percentage of returning peers who ask questions, together giving a baseline to the quantity and focus of your users' issues. Other metrics can include growth of the Data Doctor or Tableau Champions team, or the number of Tableau Days attendees.