Use Relationships for Multi-table Data Analysis
Tables that you drag to the data source tab canvas use relationships. Relationships are a flexible way to combine data for analysis in Tableau.
Think of a relationship as a contract between two tables. When you’re building a viz with fields from these tables, Tableau brings in data using that contract to build a query with the appropriate joins.
We recommend using relationships as your first approach to combining your data because it makes data preparation and analysis easier and more intuitive. Use joins only when you absolutely need to(Link opens in a new window). Learn more about the basics of creating relationships in this 5-minute video.
Note: The interface for editing relationships shown in this video differs slightly from the current release but has the same functionality.
Learn more about how relationships work in these Tableau blog posts:
- Relationships, part 1: Introducing new data modeling in Tableau(Link opens in a new window)
- Relationships, part 2: Tips and tricks(Link opens in a new window)
- Relationships, part 3: Asking questions across multiple related tables(Link opens in a new window)
Also see video podcasts on relationships from Action Analytics(Link opens in a new window), such as Why did Tableau Invent Relationships?(Link opens in a new window) Click "Video Podcast" in the Library(Link opens in a new window) to see more.
In Tableau version 2024.2 and later, the Tableau data model supports multi-fact analysis and shared dimensions through multi-fact relationships. For more information, see About Multi-fact Relationship Data Models(Link opens in a new window), When to Use a Multi-fact Relationship Model(Link opens in a new window), and Build a Multi-fact Relationship Data Model(Link opens in a new window).
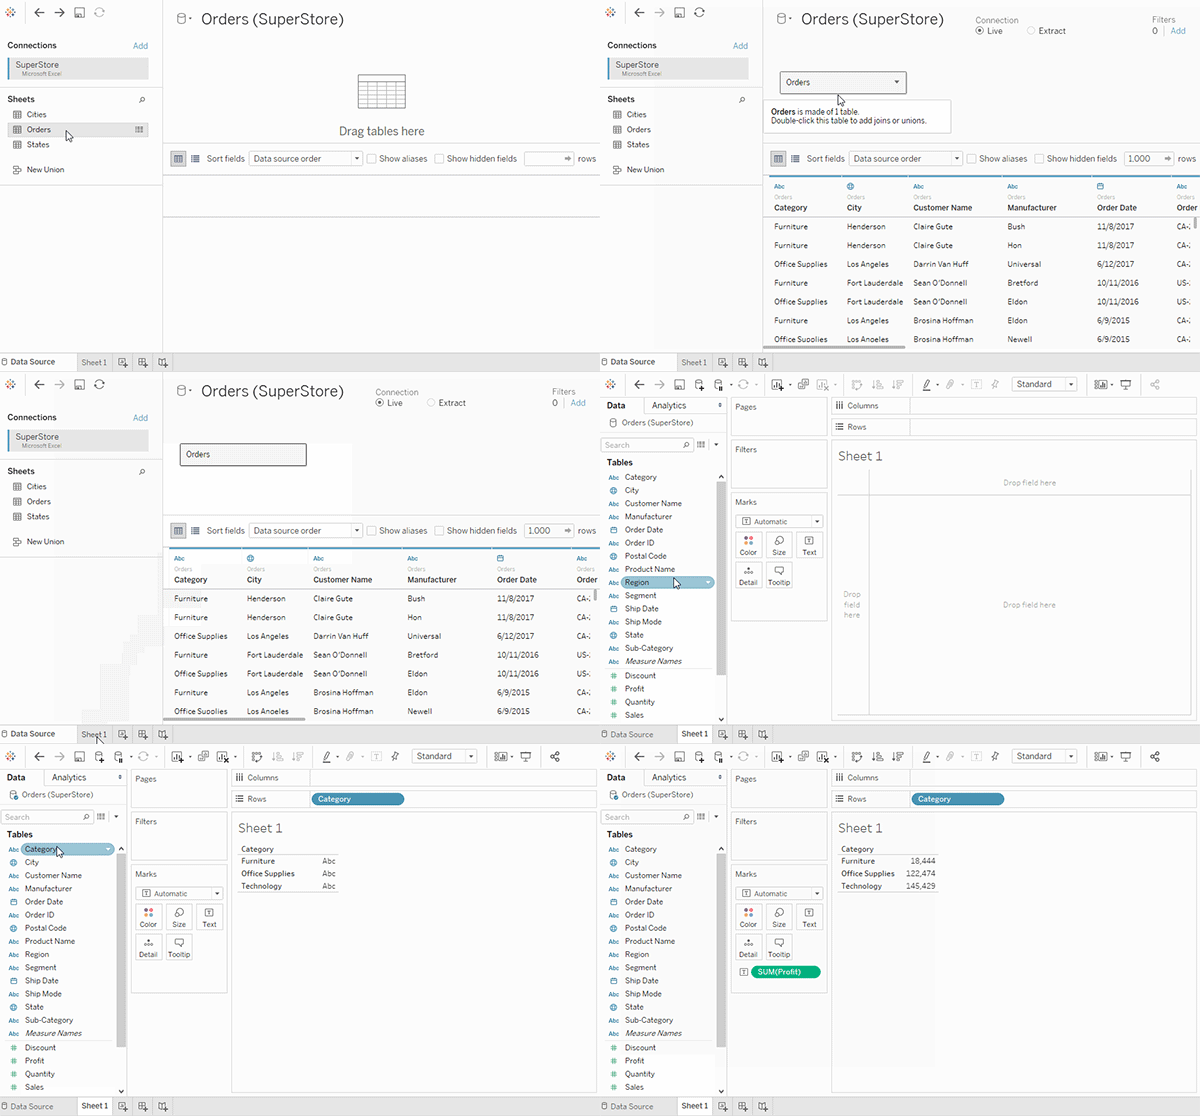
Drag a table to the Data Source page canvas to start building your data source.
A data source can be made of a single table that contains all of the dimension and measure fields you need for analysis...

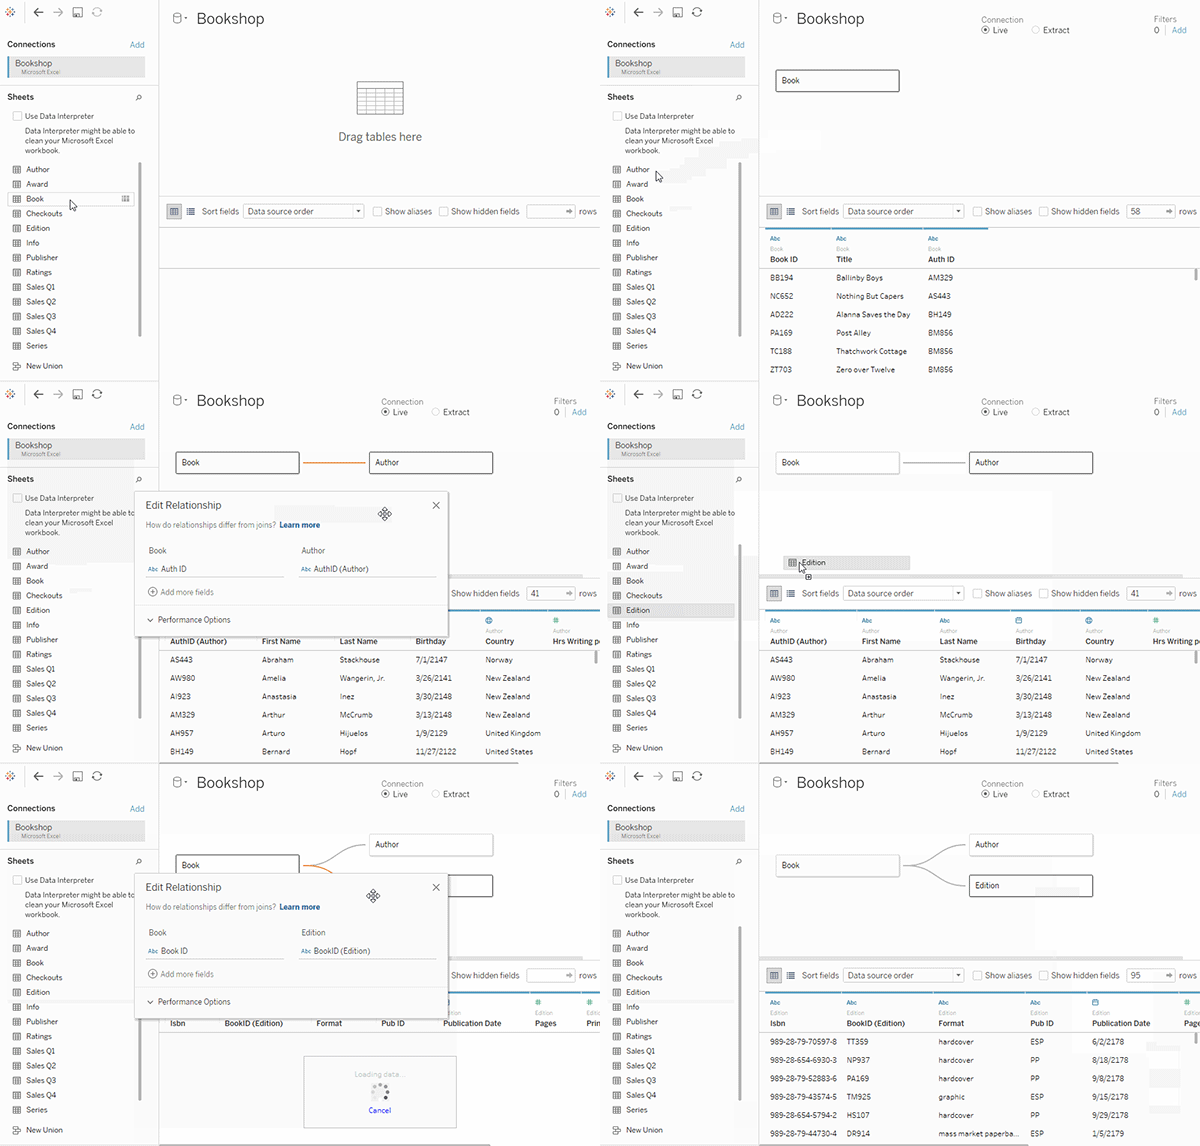
Or, you can create a multi-table data source by dragging out more tables and defining their relationships...

Watch this 1-minute video about getting started with using relationships.
Note: The interface for editing relationships shown in this video differs slightly from the current release but has the same functionality.
For more information about using relationships, see Relate Your Data, How Relationships Differ from Joins, The Tableau Data Model(Link opens in a new window), and Create and define relationships.
For more information, see What's Changed with Data Sources and Analysis(Link opens in a new window) and Questions about Relationships, the Data Model, and Data Sources(Link opens in a new window).
When you open a pre-2020.2 workbook or data source in 2020.2, your data source will appear as a single logical table in the canvas, with the name "Migrated Data" or the original table name. Your data is preserved and you can continue to use the workbook as you did before.

To see the physical tables that make up the single logical table, double-click that logical table to open it in the physical layer. You’ll see its underlying physical tables, including joins and unions.
For more information, see What's Changed with Data Sources and Analysis(Link opens in a new window) and Questions about Relationships, the Data Model, and Data Sources(Link opens in a new window).
