The Tableau Data Model
Every data source that you create in Tableau has a data model. You can think of a data model as a diagram that tells Tableau how it should query data in the connected database tables.
The tables that you add to the canvas in the Data Source page create the structure of the data model. A data model can be simple, such as a single table. Or it can be more complex, with multiple tables that use different combinations of relationships, joins, and unions.
The data model has two layers:
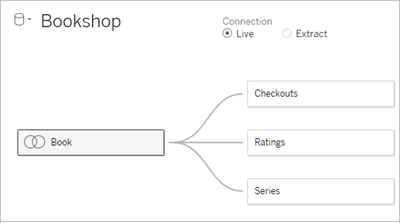
- The default view that you first see in the Data Source page canvas is the logical layer of the data source. You combine data in the logical layer using relationships (or noodles). Think of this layer as the Relationships canvas in the Data Source page. For more information, see Use Relationships for Multi-table Data Analysis(Link opens in a new window).
- The next layer is the physical layer. You combine data between tables at the physical layer using joins(Link opens in a new window) and unions. Each logical table contains at least one physical table in this layer. Think of the physical layer as the Join/Union canvas in the Data Source page. Double-click a logical table to view or add joins and unions.
| Logical Layer | Physical Layer | |
|---|---|---|
| Noodles = Relationships | Venn diagram = Joins | |
|
|
|
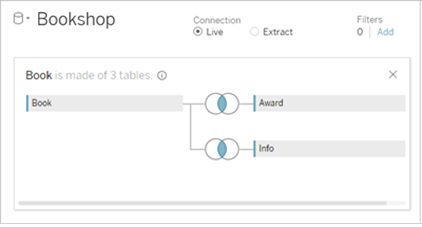
| The top-level view of a data source with multiple, related tables. This is the logical layer. Logical tables can be combined using relationships (noodles). They don't use join types. They act like containers for physical tables. | Double-click a logical table to open it and see its physical tables. Physical tables can be combined using joins or unions. In this example, the Book logical table is made of three, joined physical tables (Book, Award, Info). |
| Logical Layer | Physical Layer | |
|---|---|---|
| Relationships canvas in the Data Source page | Join/Union canvas in the Data Source page | |
| Tables that you drag here are called logical tables | Tables that you drag here are called physical tables | |
| Logical tables can be related to other logical tables | Physical tables can be joined or unioned to other physical tables | |
| Logical tables are like containers for physical tables | Double-click a logical table to see its physical tables | |
| Level of detail is at the row level of the logical table | Level of detail is at the row level of merged physical tables | |
| Logical tables remain distinct (normalized), not merged in the data source | Physical tables are merged into a single, flat table that defines the logical table |
Layers of the data model
The top-level view that you see of a data source is the logical layer of the data model. You can also think of it as the Relationships canvas, because you combine tables here using relationships instead of joins.
When you combine data from multiple tables, each table that you drag to the canvas in the logical layer must have a relationship to another table. You do not need to specify join types for relationships; during analysis Tableau automatically selects the appropriate join types based on the fields and context of analysis in the worksheet.
The physical layer of the data model is where you can combine data using joins and unions. You can only use pivots in this canvas. You can think of it as the Join/Union canvas. In previous versions of Tableau, the physical layer was the only layer in the data model. Each logical table can contain one or more physical tables.
Important: You can still create single-table data sources in Tableau that use joins and unions. The behavior of single-table analysis in Tableau has not changed. Your upgraded workbooks will work the same as they did before 2020.2.
Learn more: For related information on combining data using relationships, also see these topics and blog posts:
- How Relationships Differ from Joins
- Use Relationships for Multi-table Data Analysis
- Relate Your Data
- Relationships, part 1: Introducing new data modeling in Tableau(Link opens in a new window)
- Relationships, part 2: Tips and tricks(Link opens in a new window)
- Relationships, part 3: Asking questions across multiple related tables(Link opens in a new window)
Also see video podcasts on relationships from Action Analytics(Link opens in a new window), such as Why did Tableau Invent Relationships?(Link opens in a new window) Click "Video Podcast" in the Library(Link opens in a new window) to see more.
Understanding the data model
The data model has a logical (semantic) layer and a physical layer. This gives you more options for combining data using schemas to fit your analysis.

Each logical table contains physical tables in a physical layer.
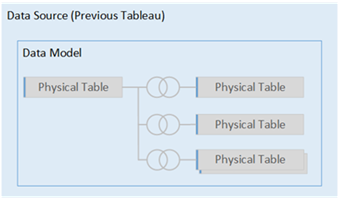
In earlier versions of Tableau (pre-2020.2), the data model in your data source consisted of a single, physical layer where you could specify joins and unions. Tables added to the physical layer (joined or unioned) create a single, flattened table (denormalized) for analysis.
| Physical Layer Data Source | Logical Layer Data Source | |
|---|---|---|
|
|
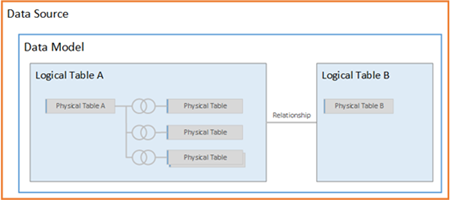
Tables at the logical layer are not merged in the data source, they remain distinct (normalized), and maintain their native level of detail.
Logical tables act like containers for merged physical tables. A logical table can contain a single, physical table. Or it can contain multiple physical tables merged together through joins or unions.
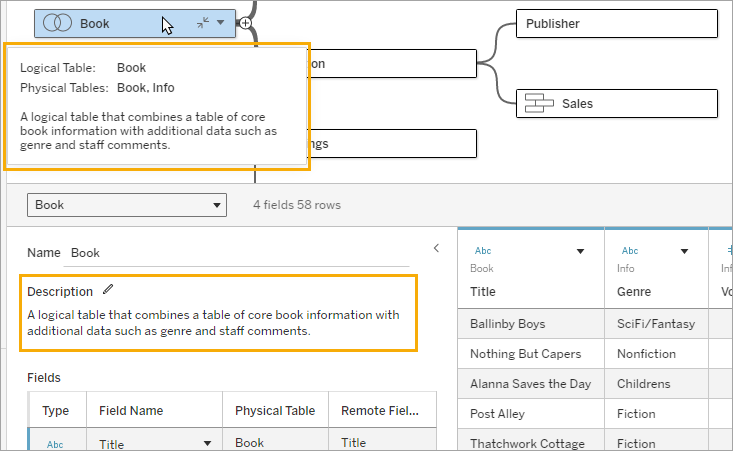
Add descriptions to logical tables
Logical tables can have descriptions that appear in their tooltips. These tooltips only appear in the Data Source tab.
To add a description:
- Select a table in the canvas
- In the bottom pane, click the edit icon (pencil) next to Description
- Enter your description in the rich text editor
Note: In web authoring only, any links in a description are live and can be clicked to open directly.
Build a new model
When you add one or more tables to the logical layer, you are essentially building the data model for your data source. A data source can be made of a single, logical table, or you can drag multiple tables to the canvas to create a more complex model.
- The first table that you drag to the canvas becomes the root table for the data model in your data source.
- After you drag out the root table, you can drag out additional tables in any order. You will need to consider which tables should be related to each other, and the matching field pairs that you define for each relationship.
- If you are creating a star schema, it can be helpful to drag the fact table out first, and then relate dimension tables to that table.
- Deleting a table in the canvas automatically deletes its related descendants as well. If you delete the root table, all other tables in the model are also removed.
- Each relationship must be made of at least one matched pair of fields. Add multiple field pairs to create a compound relationship. Matched pairs must have the same data type. Changing the data type in the Data Source page does not change this requirement. Tableau will still use the data type in the underlying database for queries.
- Relationships can be based on calculated fields.
- You can specify how fields used in the relationships should be compared by using operators when you define the relationship.
For more information about relationships, see Create and define relationships in Relate Your Data.
Multi-table model
- To create a multi-table model, drag tables to the logical layer of the Data Source page canvas.
Tables that you drag to the logical layer of the Data Source page canvas must be related to each other. When you drag additional tables to the logical layer canvas, Tableau automatically attempts to create the relationship based on existing key constraints and matching fields to define the relationship. If it can't determine the matching fields, you will need to select them.
If no constraints are detected, a Many-to-many relationship is created and referential integrity is set to Some records match. These default settings are a safe choice and provide the most a lot of flexibility for your data source. The default settings support full outer joins and optimize queries by aggregating table data before forming joins during analysis. All column and row data from each table becomes available for analysis.
You can add more data inside any logical table by double-clicking the table. This opens the physical layer of the Data Source page canvas. If you need to use joins or unions, you can drag the tables you want to join or union into the physical layer canvas. The physical tables are merged in their logical table.
Follow the steps in Create and define relationships to combine multiple tables.
Single-table model
- To create a single-table model, drag a table into the logical layer canvas of the Data Source page. You can then use the fields from that table in the Data pane for analysis.
Single-table model that contains other tables
You can add more data inside the single, logical table by double-clicking the table. This opens the physical layer of the Data Source page canvas. If you need to use joins or unions, you can drag the tables you want to join or union into the physical layer canvas. The physical tables are merged in their logical table.

This example shows the Book table in the Relationships canvas (logical layer) of the data source. Double-clicking the Book logical table opens the Join/Union canvas (physical layer).
In this example, the joins merge the Award and Info tables with the Book table. In this case, the join between Book and Award will be one-to-many, at the level of detail of awards. This would duplicate measure values for Book and Info. To avoid duplication, you could relate Award and Info to Book instead of joining them inside of the Book logical table.
Supported data model schemas
The data modeling capabilities in Tableau (version 2020.2 and later) are designed to make analysis over common multi-table data scenarios—including star and snowflake data models—easy. The following types of models are supported in Tableau data sources.
Single-table
Analysis over a single logical table that contains a mixture of dimensions and measures works just as in Tableau pre-2020.2. You can build a logical table using a combination of joins, unions, custom SQL, and so on.
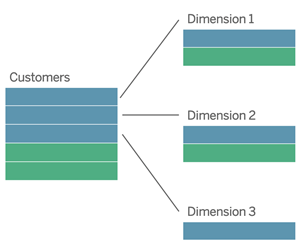
Star and snowflake
In enterprise data warehouses, it is common to have data structured in star or snowflake schemas where measures are contained in a central fact table and dimensions are stored separately in independent dimension tables. This organization of data supports many common analysis flows including rollup and drill down.
These models can be directly represented with relationships in the data modeling capabilities available in Tableau 2020.2 and later.
Drag the fact table into the model first and then relate the dimension tables to the fact table (in a star schema) or to other dimension tables (in a snowflake).
Typically, in a well-modeled star or snowflake schema, the relationships between the fact table and the dimension tables will be many-to-one. If this information is encoded in your data warehouse, Tableau will automatically use this to set the relationship’s Performance Options. If not, you can set this information yourself. For more information, see Optimize Relationship Queries Using Performance Options.
In a well-modeled star or snowflake schema, every row in the fact table will have a matching entry in each of the dimension tables. If this is true and captured in your data warehouse integrity constraints, Tableau will automatically use this information to set the referential integrity setting in Performance Options. If some fact table rows do not have a matching row in a dimension table (sometimes called “late-arriving dimensions” or “early-arriving facts”), Tableau will default to retaining all rows when computing measures, but may drop values when showing dimension headers. For more information, see Optimize Relationship Queries Using Performance Options.
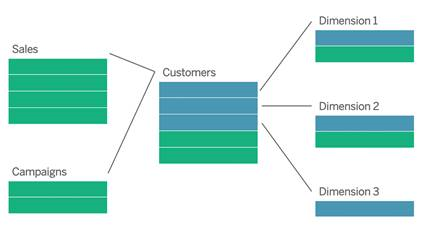
Star and snowflake with measures in more than one table
In some star or snowflake schemas, all the measures for your analysis are contained in the fact table. However, it is often true that additional measures of interest may be related to the dimension tables in your analysis. Even if the dimension tables do not contain measures, it is common in analysis to want to count or otherwise aggregate dimension values. In these cases, the distinction between fact tables and dimension tables is less clear. To create clarity when viewing your data model, we recommended adding the finest grain table to the data source canvas first, and then relating all other tables to that first table.
If you were to join these tables together into a single logical table, the measures in the dimension tables would be replicated, resulting in distorted aggregates unless you took precautions to deduplicate the values using LOD calculations or COUNT DISTINCT. However, if you instead create relationships between these tables, Tableau will aggregate measures before performing joins, avoiding the problem of unnecessary duplication. This relieves you of the need to carefully track the level of detail of your measures.
Multi-fact analysis
In version 2024.2 and later, Tableau’s data modeling capabilities support multi-fact analysis through the use of multi-fact relationships. For in-depth information on how to create multi-fact relationships data models, see:
-
About Multi-fact Relationship Data Models(Link opens in a new window)
-
When to Use a Multi-fact Relationship Model(Link opens in a new window)
-
Build a Multi-fact Relationship Data Model(Link opens in a new window)
A multi-fact relationship model—a data model with multiple base tables—permits unrelated tables in the model when shared tables also exist in the model. During analysis, fields from a shared table "stitch" together otherwise unrelated tables of data based on the shared dimensions they have in common (such as happening in the same place or at the same time). All the benefits of relationships are maintained, including the retention of each table's grain, or native level of detail.
Similar to a single base table data model, Tableau determines the best join type to use behind the scenes based on the structure of the viz. But in a multi-fact relationship model, the join options are expanded to include outer and cross joins to handle different levels of relatedness. For more information, see About Multi-fact Relationship Data Models(Link opens in a new window).
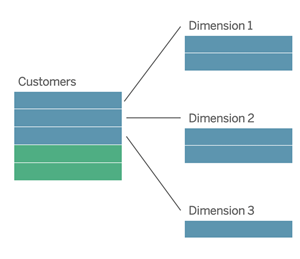
Note: In versions 2020.2 through 2024.1, you can add fact tables (containing measures) to star and snowflake models only if they are related to a single dimension table.
For example, you can bring two or more fact tables together to analyze a shared dimension, such as in Customer 360-like analyses. These fact tables can be at a different level of detail than the dimension table, or from each other. They can also have a many-to-many relationship with the dimension table. In these scenarios, Tableau will ensure that values are not replicated before aggregation.
If you don’t have a shared dimension table that relates your fact tables, you can sometimes dynamically build one using custom SQL or by using joins or unions of other dimension tables.
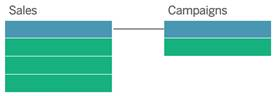
Two fact tables can be related directly to each other on a common dimension. This type of analysis works best when one of the fact tables contains a superset of the common dimension.
There are various scenarios that may indicate you should build a multi-fact relationship model with multiple base tables rather than a single base table data source:
- Circular relationships. Circular relationships are not supported. If you're trying to build a data source with a cycle, use multi-fact relationships and make the downstream table another base table instead.
- Conformed dimensions and Contextual OR relationships. If you have a series of tables that are related on the same sets of relationship clauses (such as date and location), those dimensions should be pulled out and made into shared tables instead.
- This is especially useful because multiple relationship clauses must all be true (logically, an AND) for the tables to be related for those records.
- If, instead, you want to analyze records where one may be true at a time (a contextual OR), this flexibility is provided by setting up a data model with shared dimension tables instead.
- Equivalent blends. If you're using a blend but want to have an equivalent blend without primary and secondary data sources, build a data model that combines the data sources from the blend with their linking fields in a shared table or tables.
Requirements for relationships in a data model
- When relating tables, the fields that define the relationships must have the same data type. Changing the data type in the Data Source page does not change this requirement. Tableau will still use the data type in the underlying database for queries.
- You can't define relationships based on geographic fields.
- Circular relationships aren't supported in the data model.
Factors that limit the benefits of using related tables
- Dirty data in tables (i.e. tables that weren't created with a well-structured model in mind and contain a mix of measures and dimensions in multiple tables) can make multi-table analysis more complex.
- Using data source filters will limit Tableau's ability to do join culling in the data. Join culling is a term for how Tableau simplifies queries by removing unnecessary joins.
- Tables with a lot of unmatched values across relationships.