What's Changed with Data Sources and Analysis
Starting in Tableau version 2020.2, several major enhancements make multi-table analysis easier and more intuitive.
Data modeling capabilities in Tableau help you more easily analyze data across multiple tables. With a logical layer and relationships in data sources, you can create multi-table data models in the form of star and snowflake schemas with multiple fact tables at different levels of detail (LOD).
- Data sources are easier to build, maintain, and analyze. Data sources have a new logical layer where you can create flexible relationships between tables. Create multi-table, multi-fact data models by relating tables at different levels of detail. Bring in data from multiple tables more easily and maintain fewer data sources to meet your analytical needs.
- Relationships make the analysis experience more intuitive. You no longer need to engage in extensive join planning and make assumptions about what join types will be required to make your data ready for analysis. Tableau automatically selects join types based on the fields being used in the visualization. During analysis, Tableau adjusts join types intelligently and preserves the native level of detail in your data. You can see aggregations at the level of detail of the fields in your viz rather than having to think about the underlying joins. Relationships can be many-to-many and support full outer joins. You don't need to use LOD expressions such as FIXED to deduplicate data in related tables.
- The Data Source page, View Data window, and Data pane have been updated to support a multi-table analysis experience. Your first view of the Data Source page canvas is the logical layer, where you can define relationships between tables. In support of multi-table analysis, several parts of the Tableau interface have changed. The Data Source page (canvas, data grid), View Data window, and the Data pane in the worksheet have all been updated to support a multi-table analysis experience. For more information, see Changes to different parts of the interface(Link opens in a new window). The API to access View Data has also been updated to support multi-table analysis.
- Context-aware queries bring in relevant data when it’s needed. A data source that uses relationships makes it easier to bring more tables, more rows of data, and multiple fact tables into a single data source. Rather than querying the entire data source, Tableau brings in data from the tables that are needed for the worksheet, based on the fields at play in the visualization.
Watch a video: For an overview of data source enhancements and an introduction to using relationships in Tableau, see this 5-minute video.
Note: The interface for editing relationships shown in this video differs slightly from the current release but has the same functionality.
Learn more about how relationship queries work in these Tableau blog posts:
- Relationships, part 1: Introducing new data modeling in Tableau(Link opens in a new window)
- Relationships, part 2: Tips and tricks(Link opens in a new window)
- Relationships, part 3: Asking questions across multiple related tables(Link opens in a new window)
Also see video podcasts on relationships from Action Analytics(Link opens in a new window), such as Why did Tableau Invent Relationships?(Link opens in a new window) Click "Video Podcast" in the Library(Link opens in a new window) to see more.
Changes to data sources, the data model, and query semantics
Support for multi-table data sources
Data sources in Tableau recognize and preserve normalized data. With multi-table data sources, Tableau can handle multiple levels of detail in a single data source. This support makes it easier for you to prepare and explore your data without having to write specialized calculations to control aggregations like averages and totals. Combine tables in star and snowflake schemas to seamlessly relate multiple fact tables. The new logical layer uses contextual, dynamic joins and gives you better domain control (see Supported data model schemas).
Tableau recognizes and maintains the underlying relationships between tables, so fewer joins and calculations should be needed. Because these enhanced data sources can answer a wider variety of questions, you can consolidate the number of distinct data sources you need to create and maintain. Fewer data sources are needed to represent the same data.
What didn't change?
Relationships in the logical layer give you more options for combining data (nothing has been taken away). You can still create single-table data sources in Tableau. You can build a logical table using a combination of joins, unions, custom SQL, and so on. The behavior of single-table analysis in Tableau hasn’t changed. Analysis over a single logical table that contains a mixture of dimensions and measures works the same as Tableau version 2020.1 and earlier.
Also see Questions about Relationships, the Data Model, and Data Sources.
New logical layer in the data source
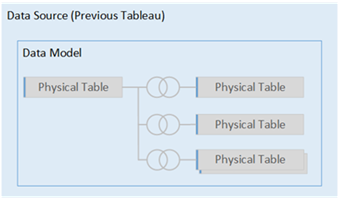
In previous versions of Tableau, the data model in your data source consisted of a single, physical layer where you could specify joins(Link opens in a new window) and unions. Tables added to the physical layer (joined or unioned) create a single, flattened table (denormalized) for analysis.
| Previous versions | 2020.2 and later | |
|---|---|---|
|
|
|
| In Tableau version 2020.1 and earlier, the data model has only the physical layer | In Tableau version 2020.2 and later, the data model has two layers: the logical layer and the physical layer |
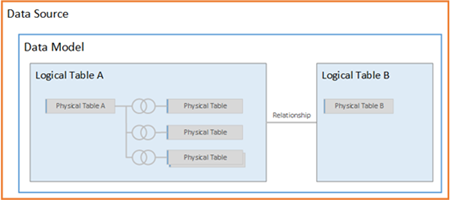
Starting in Tableau version 2020.2, the data model in your data source includes a new semantic layer above the physical layer—called the logical layer—where you can add multiple tables and relate them to each other based on matched field pairs. Tables at the logical layer aren’t merged in the data source, they remain distinct (normalized), and maintain their native level of detail.
Logical tables act like containers for physical tables. You can still use joins and unions between physical tables. Just double-click a logical table to open it and work with joins or unions.
The logical layer makes it easier for you to combine your data for a variety of analytics scenarios. You can use and create normalized data models in the form of star and snowflake schemas, and flexible models with fact tables at different grains.
For more information, see The Tableau Data Model and Supported data model schemas.
Query semantics based on relationships
Relationships are a dynamic, flexible way to combine data from multiple tables for analysis. Relationships can be many-to-many and support full outer joins. You don't need to use LOD expressions such as FIXED to deduplicate data in related tables.
Think of a relationship as a contract between two tables. When you are building a viz with fields from these tables, Tableau brings in data from these tables using that contract to build a query with the appropriate joins.
We recommend using relationships as your first approach to combining your data because it makes data preparation and analysis easier and more intuitive. Use joins only when you absolutely need to(Link opens in a new window).
- No up-front join type. You only need to select matching fields to define a relationship (no join types). Because you don't specify the join type, you won't see a Venn diagram when you’re setting up relationships.
- Automatic and context-aware. Relationships defer joins to the time and context of analysis. Tableau automatically selects join types based on the fields being used in the visualization. During analysis, Tableau adjusts join types intelligently and preserves the native level of detail in your data. You can see aggregations at the level of detail of the fields in your viz rather than having to think about the underlying joins.
- Flexible. When you combine tables using relationships, it’s like creating a custom, flexible data source for every viz, all in a single data source for the workbook. Because Tableau queries only tables that are needed based on fields and filters in a viz, you can build a data source that can be used for a variety of analytic flows.
For more information, see Relate Your Data(Link opens in a new window), Don’t Be Scared of Relationships(Link opens in a new window), and Relationships, part 1: Introducing new data modeling in Tableau(Link opens in a new window).
Note: To go to the original join canvas, double-click a logical table in the top level view (the logical layer of the data source). You can still add joins and unions between tables in the physical layer of the data source. For more information, see The Tableau Data Model.
Migrated data sources
When you open a pre-2020.2 workbook or data source in Tableau version 2020.2 and later, your data source will appear as a single logical table in the canvas. You can continue to use the workbook as you did before.
If your data source contained multiple joined or unioned tables, the single logical table is displayed with the name "Migrated Data". You can rename the Migrated Data table.
To see the physical tables that make up the single logical table, double-click that logical table to open it in the physical layer. You’ll see its underlying physical tables, including joins and unions.

Web Authoring
Your workbook must use an embedded data source for you to be able to edit relationships and performance options in the Data Source page in web authoring in Tableau Server or Tableau Cloud.
Extracts
Extract data can be stored based on logical tables (replaces the Single Table option) or physical tables (replaces the Multiple Tables option). For more information, see Extract Your Data.
Changes to different parts of the interface
Data Source page changes
The Data Source page canvas has two layers: a logical layer and a physical layer. The default view that you see in the Data Source page is new; it shows the logical layer, which uses relationships ("noodles") between tables.
You can still add joins and unions between tables in the physical layer, just double-click a logical table in the logical, top-level view to switch to the physical layer. For more information, see The Tableau Data Model.

Data Grid
When the data source is made of multiple, related tables, selecting a logical table displays that table's data in the data grid that is displayed below the data model. With relationships, the data hasn’t been merged, so you will be seeing the values for the currently selected logical table. If you need to pivot columns, you must open a logical table and pivot the data in the physical table view of the data source.

Data pane in worksheets
To support relationships and multi-table analysis, the Data pane has been updated.
You will no longer see the Dimensions and Measures labels in the Data pane. Dimension and measure fields can be organized by table (Group by Data Source Table) or folder (Group by Folder). Dimensions are displayed above the gray line, and measures below the gray line for each table or folder. In some cases, a table might show only dimensions, or only measures to start with.

You will no longer see the Number of Records field in data sources that contain logical tables. Every table includes a count of its records, as a field named TableName(Count), at the level of detail for that table. In the previous example you can see Addresses(Count), Customers(Count), and LineItems(Count).
COUNT of table = SUM of Number of Records per table. You can't build calculations on top of a table's Count field. Count is aggregate-only.
Note: You might see the Number of Records field in the Data pane if you open a pre-2020.2 workbook that used Number of Records in a view.
Calculated fields are listed with their originating field, if all of their input fields come from the same table.
Sets and groups are displayed under the table with their originating field.
Fields that don't belong to a specific table or aren't grouped under a folder are displayed in the general area below the tables. These field types include: aggregated calculations, calculations that use fields from multiple tables, Number of Records when applicable, Measure Names, and Measure Values.
In version 2024.2 and later: Field names are displayed in light gray text in the Data pane when they're not related to any fields in use in the view. You can still use these fields for analysis in the viz, but unrelated fields are evaluated differently in analysis than fields that are related. You might see this behavior if you are using a data source with multi-fact relationships(Link opens in a new window).
View Data
In the View Data window, when the data source contains multiple logical tables, the number of rows and data are listed at the native level of detail for each table in separate tabs.
For more information, see View Underlying Data.
Calculated fields are listed with their originating field.
LOD calculations won't necessarily appear in View Data for a logical table because an LOD calculation might be at a different granularity than the table itself. If the dimensionality of an LOD calc includes fields from a single table, that LOD calculation will appear in its owning table in the Data pane.
View Data column order changes in Tableau version 2020.2 and later
When you open a data source from a Tableau version 2020.1 and earlier in Tableau version 2020.2 and later, the column order might be different. Columns might be displayed differently in the View Data window, and the column order might be different when you export it to CSV format.
This change in how column order is handled in the View Data window is required to support relationships and logical tables.
If you use scripts that depend on a customized column order, we recommend using the Tableau Extensions API for View Data to download underlying data to CSV format.
Changes to analysis with multi-table data sources
Using a data source that has multiple, related tables affects how analysis works in Tableau. Because multiple, related tables have independent domains and retain their native level of detail, when you drag fields into the view:
- Data is queried at its natural level of detail.
- Only data that is relevant to a viz is queried.
- The relationships between the tables affect the results of the query. The flow of building a viz can vary depending on how tables of fields are related to each other in the data model, or if they aren't related directly.
Benefits of using muti-table data sources with relationships:
- Relationships use joins, but they’re automatic. Tableau automatically selects join types based on the fields being used in the visualization. During analysis, Tableau adjusts join types intelligently and preserves the native level of detail in your data.
- Tableau uses relationships to generate correct aggregations and appropriate joins during analysis, based on the current context of the fields in use in a worksheet.
- Multiple tables at different levels of detail are supported in a single data source, so fewer data sources are needed to represent the same data.
- Unmatched measure values aren’t dropped (no accidental loss of data).
- Related tables reduce or eliminate data duplication and filtering issues that can sometimes result from joins.
For more information, see Relate Your Data, How Analysis Works for Data Sources that Use Relationships and Troubleshooting multi-table analysis.
For related information about how relationship queries work, see these Tableau blog posts:
- Relationships, part 1: Introducing new data modeling in Tableau(Link opens in a new window)
- Relationships, part 2: Tips and tricks(Link opens in a new window)
In Tableau version 2024.2 and later, the Tableau data model supports multi-fact analysis and shared dimensions through multi-fact relationships. For more information, see About Multi-fact Relationship Data Models(Link opens in a new window), When to Use a Multi-fact Relationship Model(Link opens in a new window), and Build a Multi-fact Relationship Data Model(Link opens in a new window).
What didn't change?
The behavior of single-table analysis in Tableau hasn’t changed. Analysis over a single logical table that contains a mixture of dimensions and measures works as it did in Tableau pre-2020.2.
Dimension-only visualizations
When using a multi-table data source with related tables: If you build a dimension-only viz, Tableau uses inner joins and you won't see the full unmatched domain.
To see partial combinations of dimension values, you can:
- Use Show Empty Rows/Columns to see all of the possible rows. Click the Analysis menu, and then select Table Layout > Show Empty Rows or Show Empty Columns. Be aware that this setting will also trigger densification for Date and Numeric Bin fields, which might be unwanted.
- Add a measure to the view, such as <YourTable>(Count) from one of the tables represented in your viz. This step ensures that you’ll see all values of the dimensions from that table.
Unmatched values behavior for dimensions that might surprise you
When you build a visualization that uses dimensions from multiple logical tables, the behavior can be initially surprising. By default, if the dimensions in a visualization or the inputs to a row-level calculations use fields from multiple logical tables, Tableau will only display results where all the dimensions have matching values.
For example, consider a data set that contains two logical tables, Customers and Purchases. Some Customers have made no Purchases and have no matching rows in the Purchases table. If you bring the dimension [Customers].[Customer Name] into play, you’ll see a list of all customers whether they made a Purchase or didn't. If you then add the dimension [Purchases].[Product] to the visualization, Tableau will update to show the Customers who made purchases along with the Products they bought.
Here are several ways you can work with this default behavior:
- Use Show Empty Rows/Columns to see all of the possible rows and bring back the unmatched dimension values. Click the Analysis menu, and then select Table Layout > Show Empty Rows or Show Empty Columns. Be aware that this setting will also trigger densification for Date and Numeric Bin fields, which you might not want.
- Convert one of the dimensions to a measure. For example, switching to use COUNT([Purchases].[Product]) will keep Customers with no purchases and display a "0" for them. This approach might not be viable if you want to see all of the Products.
- Bring a measure into the view from the table with unmatched values. For example, adding COUNT([Customers]) on the detail shelf would bring back the unmatched customers, while still showing all the Products.
- Instead of relating the two tables at the logical level, you can join them using an outer join at the physical level, as in previous versions of Tableau. This approach will show the unmatched values, with a few side effects. Queries will always be issued by querying both tables. NULL values will appear in visualizations and quick filters even when no fields from the unmatched table are used. And, you’ll have to write LOD calculations to remove any unwanted duplication introduced by the join.
Using a table's Count field instead of Number of Records
You will no longer see the Number of Records field in data sources that contain logical tables. Every table includes a count of its records, as a field named TableName(Count), at the level of detail for that table. In the previous example you can see Addresses(Count), Customers(Count), and LineItems(Count).
COUNT of table = SUM of Number of Records per table. You can't build calculations on top of a table's Count field. Count is aggregate-only.
Note: You might see the Number of Records field in the Data pane if you open a pre-2020.2 workbook that used Number of Records in a view.
Cross-table calculations
You can write calculations that span multiple tables. Be aware that cross-table calculations use inner join query semantics by default. The calculation lives on top of the join between the logical tables that it references. With relationships, it is possible to write row-level calculations across tables that result in outer joins.
Calculations are evaluated after Null dimensions are added, so you can change a Null to something else using a calculation like: IFNULL([Dimension], “Missing”).
Grand totals using SUM
Grand totals using SUM reflect the actual total at the native level of detail of a field's logical table, rather than the SUM of subtotals.
Nulls and automatic joins that result from relationships
In Tableau version 2020.2 and later, when performing joins that result from relationships, Tableau does not join nulls against nulls.
Unmatched null behavior
When you add a measure to the view, a Null dimension value is added when the measure has values that are not associated with a dimension.
This behavior occurs because Tableau treats unmatched values (or non-associated dimension values) the same as true NULL values in the underlying data source. Values for both will be aggregated together or filtered together.
For example, with SUM(Sales),[State] every matched State represents a state. Its SUM(Sales) is the sum for a single state. For unmatched nulls, SUM(Sales) may reflect many states.
If you don't want this behavior, you can clean your data to make sure that every row in the measure table matches a row in the dimension table. You can use Tableau Prep for this. Or, within a sheet, you can filter out the Null by clicking on the Null and selecting Exclude. After you do this, you can edit the relationship between the measure table and the dimensions table by selecting All Records Match in the Performance Options settings.
Dealing with unmatched nulls in the Edit Filter dialog box
When you apply a filter to a dimension, the rules for when the Null appears are:
- On the General tab, you can explicitly include or exclude the Null row using the check box.
- On the Wildcard tab, the setting won’t impact whether or not Null appears (since it only filters out text values and Null is not treated as a text value).
- On the Condition or Top tabs, using a setting other than None will cause the “Null” state to be filtered out.
Validating relationships
You have several options for validating your data model for analysis. As you create the model for your data source, we recommend going to a sheet, selecting that data source, and then building a viz to explore record counts, expected data, unmatched values, nulls, or repeated measure values. Try working with fields across different tables to ensure everything looks how you expect it to.
What to look for:
- Are your relationships in the data model using the correct matching fields for their tables?
- Would adding multiple matching field pairs make the relationship more accurate?
- What are the results of dragging different dimensions and measures into the view from different tables?
- Are you seeing the expected number of rows?
- If you changed any of the Performance Options settings from the default settings, are the values that you are seeing in the viz what you would expect? If they aren't, you might want to check the settings, or reset to the default.
Options for validating relationships and the data model:
- Every table includes a count of its records, as a field named TableName(Count), at the level of detail for that table. To see the count for a table, drag its Count field into the view. To see the count for all tables, select the Count field for each table in the Data pane, and then click the Text Table in Show Me.
- Click View Data in the Data pane to see the number of rows and data per table. Also, before you start creating relationships, viewing the data from the data source before or during analysis can be useful to give you a sense of the scope of each table. For more information, see View Underlying Data.
- Drag dimensions onto rows to see the Number of Rows in the status bar. To see unmatched values, click the Analysis menu, and then select Table Layout > Show Empty Rows or Show Empty Columns. You can also drag different measures to the view, such as <YourTable>(Count) from one of the tables represented in your viz. This ensures that you will see all values of the dimensions from that table.
Tip: If you would like to see the queries that are being generated for relationships, you can use the Performance Recorder in Tableau Desktop.
- Click the Help menu, and then select Settings and Performance > Start Performance Recording.
- Drag fields into the view to build your viz.
- Click the Help menu, and then select Settings and Performance > Stop Performance Recording. The Performance Recording workbook will automatically open.
- In the Performance Summary dashboard, under Events Sorted By Time, click an "Executing Query" bar and view the query below.
Another more advanced option is to use the Tableau Log Viewer(Link opens in a new window) on GitHub. You can filter on a specific keyword using end-protocol.query. For more information, start with the Tableau Log Viewer wiki page(Link opens in a new window) in GitHub.