Create a Dashboard
After you've created one or more sheets, you can combine them in a dashboard, add interactivity, and much more.
Tip: To quickly get up and running, see Use Accelerators to Quickly Visualize Data.
Create a dashboard, and add or replace sheets
You create a dashboard in much the same way you create a new worksheet.
- At the bottom of the workbook, click the New Dashboard icon:
- From the Sheets list at left, drag views to your dashboard at right.

- To replace a sheet, select it in the dashboard at right. In the Sheets list at left, hover over the replacement sheet, and click the Swap Sheets button.

Note: When you replace a sheet, Tableau retains any padding, border, or background color. However, you may need to adjust sheet size if content differs significantly. You may also need to delete dashboard items specific to the previous sheet, such as filters, which become blank.
Add interactivity
You can add interactivity to dashboards to enhance users' data insights. Try these techniques:
- In the upper corner of sheet, enable the Use as Filter option to use selected marks in the sheet as filters for other sheets in the dashboard.

- When authoring in Tableau Desktop, add actions to use multiple sheets as filters, navigate from one sheet to another, display web pages, and more. For details, see Actions and Dashboards.
Add dashboard objects and set their options
In addition to sheets, you can add dashboard objects that add visual appeal and interactivity. Here's guidance about each type:
- Horizontal and Vertical objects provide layout containers that let you group related objects together and fine-tune how your dashboard resizes when users interact with them.
- Text objects can provide headers, explanations, and other information.
Note: Rich text formatting supporting live hyperlinks in a text box is supported only on the web.
- Image objects add to the visual flavor of a dashboard, and you can link them to specific target URLs. (While Web Page objects can also be used for images, they are better for complete web pages. The Image object provides image-specific fitting, linking, and alt-text options.)
- Web Page objects display target pages in the context of your dashboard. Be sure to review these web security options, and be aware that some web pages don't allow themselves to be embedded—Google is one example.
Note: For security reasons, your Tableau administrator may prevent Web Page and Image objects from displaying target URLs.
- Blank objects help you adjust spacing between dashboard items.
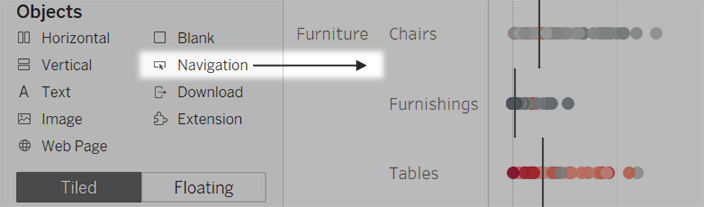
- Navigation objects let your audience navigate from one dashboard to another, or to other sheets or stories. You can display text or an image to indicate the button's destination to your users, specify custom border and background colors, and provide informational tooltips.
- Download objects let your audience quickly create a PDF file, PowerPoint slide, or PNG image of an entire dashboard, or a crosstab of selected sheets. Formatting options are similar to Navigation objects.
Note: Crosstab download is possible only after publishing to Tableau Cloud or Tableau Server.
- Extension objects let you add unique features to dashboards or integrate them with applications outside Tableau.
- Pulse Metric objects let you embed existing metric cards in your dashboard. The metrics that you can add are connected to the same published data sources that are used by the workbook.
Add an object
From the Objects section at left, and drag an item to the dashboard on the right:
Copy objects
You can copy and paste objects either within the current dashboard, or from dashboards in other sheets and files. You can even copy objects between Tableau Desktop and Tableau in your web browser.
You can't, however, copy the following:
- Sheets in a dashboard
- Items that rely on a specific sheet, such as filters, parameters, and legends
- Layout containers with something you can't copy inside them, like a sheet or filter
- Objects on a device layout
- Dashboard titles
Tip: In addition to the menu commands described below, you can also use the standard keyboard shortcuts for copying and pasting on your operating system.
- Select a dashboard object, and from the object menu, select Copy Dashboard Item. Or from the main menu, select Dashboard > Copy Selected Dashboard Item.

- Go to the dashboard where you want to paste the object. Then either select nothing to paste in the upper-left corner of the dashboard, or select an existing item to paste next to.
- In Tableau Desktop, choose File > Paste. In a browser, either choose Edit > Paste or use the keyboard shortcut for pasting.
- The object is pasted 10 pixels below and to the right of the upper-left corner of the dashboard or the selected object. To move the pasted object, drag the handle at the top.

Note: Copied Show/Hide buttons may target the original object or be disabled. For instructions on how to fix this, see Show and hide objects by clicking a button.
Set options for objects
Click the object to select it. Then click the arrow in the upper corner to open the shortcut menu. (The menu options vary depending on the object.)
Detailed options for Image objects
With the Image object, you can either insert image files into dashboards or link to images posted on the web. In either case, you can specify a URL the image opens when clicked, adding interactivity to your dashboard.
Notes: URLs for web-based images require the HTTPS prefix for improved security. For image URLs with other prefixes, use the Web Page object.
Tableau blocks the loading of SVG files that contain scripts for security reasons. If your image object contains a script, remove the script from the SVG file or save the image in a different format, such as .png or .jpeg.
- From the Objects section at left, drag an Image object to your dashboard at right. Or, on an existing Image object in a dashboard, click the pop-up menu in the upper corner, and choose Edit Image.
- Click either Insert Image File to embed an image file into the workbook or Link to Image to link to a web-based image.
Consider linking to a web-based image when:
- The image is very large and your dashboard audience will view it in a browser. (Unlike web-based images, inserted images must be downloaded every time a sheet opens, slowing performance.)
- The image is an animated GIF file. (Inserted images don't support animated GIFs.)
- If you're inserting an image, click Choose to select the file. If you're linking to an image, enter its web URL.
- Set remaining image fitting, URL linking, and alt text options. (Alt text describes the image in screen-reading applications for improved accessibility.)

Detailed options for Navigation and Download objects
Navigation and Download objects have several unique options that help you visually indicate a navigation destination or file format.
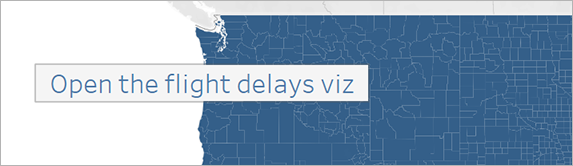
A navigation button using text for the button style
- In the upper corner of the object, click the object menu, and choose Edit Button.

- Do one of the following:
- From the Navigate to menu, choose a sheet outside the current dashboard.
- From the Export to menu, choose a file format.
- Choose image or text for Button Style, specify the image or text you want to appear, and then set related formatting options.
- For Tooltip text, add explanatory text that appears when viewers hover over the button. This text is optional and typically best used with image buttons. (For example, you might enter "Open Sales viz" to clarify the destination for a navigation button that appears as a miniature sales chart.)
Note: When viewing a published dashboard, simply clicking a button navigates or exports. When authoring a dashboard, however, you need to Alt-click (Windows) or Option-click (macOS).
Show and hide objects by clicking a button
Show/Hide buttons let dashboard viewers toggle the visibility of dashboard objects, revealing them only when necessary.
How hidden objects affect layouts
When a floating object is hidden, it simply reveals any objects beneath it. Show/Hide buttons can be particularly helpful when you want to temporarily hide a floating group of filters to reveal more of a visualization.

When a tiled object is hidden, the results depend on the object's level in the layout hierarchy.
- In most cases, you'll want to place objects you plan to hide in a Horizontal or Vertical layout container, because hidden objects will have their space filled in by other objects in the container.
- By contrast, in the Tiled layout container at the very top of the layout hierarchy, a hidden object leaves blank space behind.
Add and configure a Show/Hide button
- Select a dashboard object.
- From the pop-up menu in the upper corner of the object, select Add Show/Hide Button.

- From the button menu, choose Edit Button.

- Set these options:
- Dashboard Item to Show/Hide specifies the target object. (An object can be the target of only one Show/Hide button at a time. Choose None if you want to target the object with another Show/Hide button.)
- Button Style specifies whether image or text displays for the button.
- Button Appearance specifies how the button looks when the item is both shown and hidden. Click Item Shown and Item Hidden to choose different images or text for each state.
- Tooltip text provides explanatory text that appears when viewers hover over the button. (For example, you might enter "Show or hide filters" for a container with filter menus.)
- If necessary, drag the button to a different location or resize it to better fit your layout.
Note: When viewing a published dashboard, simply clicking a Show/Hide button toggles object visibility. When authoring a dashboard, however, you need to Alt-click (Windows) or Option-click (macOS).
Security for Web Page objects
If you include Web Page objects in your dashboard, you can optimize security by doing the following.
Use HTTPS protocol when possible
As a best practice, use HTTPS (https://) in your URLs. This ensures that the connection from your dashboard to the web page is encrypted. Also, if Tableau Server is running HTTPS and you use HTTP in the URL, your users' browsers won't be able to display the web page that the URL points to. If you don't specify a protocol, HTTP will be assumed.
Security options for Web Page objects (Tableau Desktop only)
Choose Help > Settings and Performance > Set Dashboard Web View Security, and set the options below. (In some organizations, these options are controlled across all machines by a Tableau administrator.)
Note: Any changes you make to these security options apply to both existing and newly created web page objects.
- Enable JavaScript Allows JavaScript support in the web view. Clearing this option may cause some web pages that require JavaScript to function improperly in the dashboard.
- Enable Plug-ins Enables any plug-ins the web page uses, such as an Adobe Flash or QuickTime player.
- Block Pop-ups When selected, blocks pop-ups.
- Enable URL Hover Actions Allows URL hover actions. For more information, see URL Actions.
- Enable Web Page Objects and Web Images Allows the display of target URLs in Web Page and Image objects. If you deselect this option, Web Page objects and Image objects that link to the web remain in the dashboard but show no content.