Prepare Data on the Web
After you connect to data in Tableau Cloud or Tableau Server, you can use the Data Source page to set up your data source and prepare your data for analysis. Having data that is formatted in a way Tableau likes is crucial to building a view or doing analysis in Tableau, and communicating the right information to the right people.
This article describes preparing your data in the browser with Tableau Cloud or Tableau Server. Although Tableau supports many of the same functionality for preparing your data for analysis in the browser as Tableau Desktop, for specific differences between the two, see Web Authoring and Tableau Desktop Feature Comparison.
Note on keeping your data fresh: If you connect to a published flat file (Excel or text), that data will not be refreshed even if it’s modified. If your data is in an on-premises server and is published to the web through Tableau Desktop, it will be rendered as an extract and won’t be refreshed. If you need to keep data published through Tableau Desktop fresh on the web, you can use Tableau Bridge. To learn more about these requirements, see Keep Data Fresh and Use Bridge to Keep Data Fresh
Tour the Data Source page
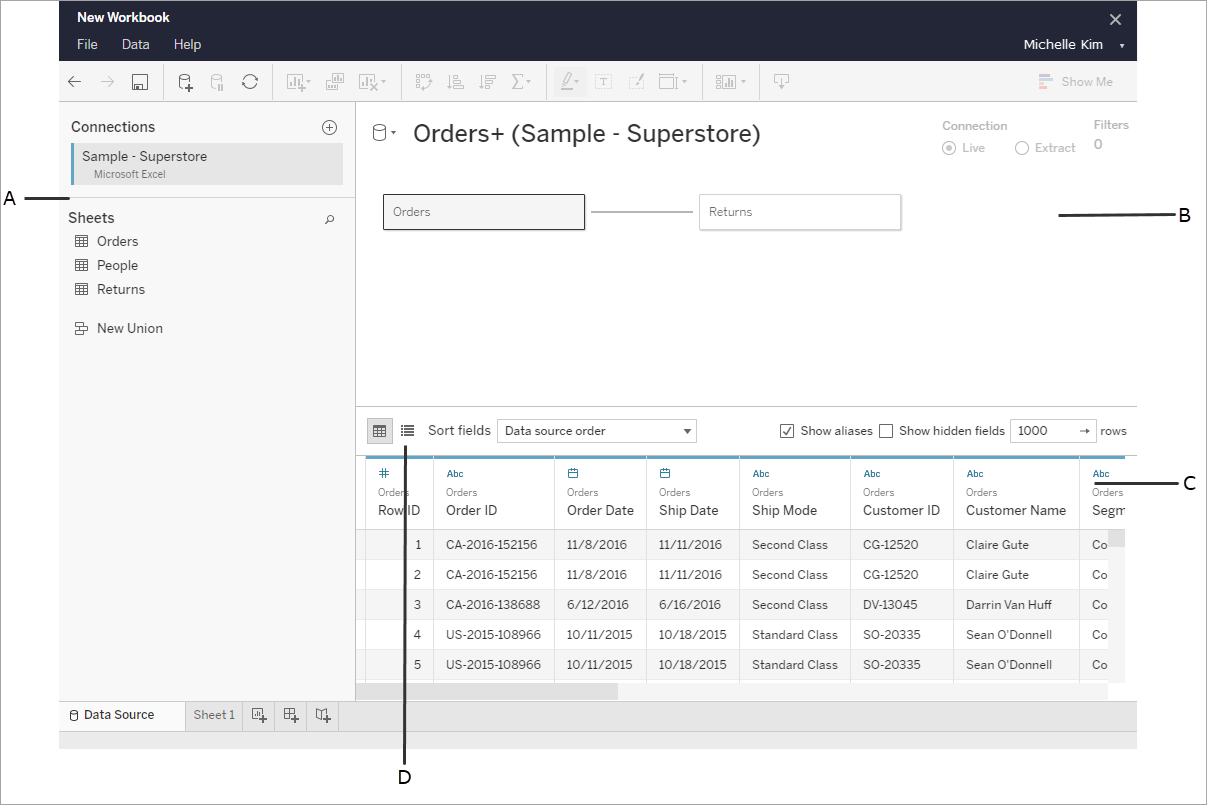
There are four parts of the data source page:
A: Left pane
Displays details about your data connection. For example, for Excel-based data, the left pane shows your Excel workbook name, and sheets contained in that workbook. For databases, the left pane displays the server, the database or schema, and tables in the database.
B: Canvas
When connected to most relational and file-based data, you can drag one or more tables to the canvas area to join tables for analysis.
In the canvas, you can also join tables from the same or multiple data sources
C: Data grid
You can use the data grid to review or rename fields, create calculations, preview your changes, and more.
D: Metadata grid
Select the metadata grid button to see the fields in your data source as rows. This view is helpful in understanding the structure of your data source.
Set up data sources
After you connect to your data, use the Data Source page to set up the data source and prepare your data for analysis. There are many optional configurations that you can make before you begin your analysis. The configurations that you make on the Data Source page creates the data source that Tableau uses to interpret and interact with your data.
Connect to a Custom SQL Query(Link opens in a new window)
Convert a Field to a Date Field
Pivot Data from Columns to Rows
Clean Data from Excel, CSV, PDF, and Google Sheets with Data Interpreter
Edit and sort fields in the data grid
You can make changes to your fields in the data grid. You can rename your fields, group them, create aliases, create calculated fields, change data type, and convert to a measure.
Understand Field Type Detection and Naming Improvements
Get Started with Calculations in Tableau
Convert a Field to a Date Field
Field types: Dimensions and Measures, Blue and Green