Clean Data from Excel, CSV, PDF, and Google Sheets with Data Interpreter
When you track data in Excel spreadsheets, you create them with the human interface in mind. To make your spreadsheets easy to read, you might include things like titles, stacked headers, notes, maybe empty rows and columns to add white space, and you probably have multiple tabs of data too.
When you want to analyze this data in Tableau, these aesthetically pleasing attributes make it very difficult for Tableau to interpret your data. That’s where Data Interpreter can help.
Tip: Though Tableau's Excel add-in is no longer supported, Data Interpreter can help you reshape your data for analysis in Tableau.
What does Data Interpreter do?
Data Interpreter can give you a head start when cleaning your data. It can detect things like titles, notes, footers, empty cells, and so on and bypass them to identify the actual fields and values in your data set.
It can even detect additional tables and sub-tables so that you can work with a subset of your data independently of the other data.
After Data Interpreter has done its magic, you can check its work to make sure it captured the data that you wanted and identified it correctly. Then, you can make any necessary adjustments.
After you select the data that you want to work with, you might also need to do some additional cleaning steps like pivoting your data, splitting fields, or adding filters to get the data in the shape you want before starting your analysis.
Note: If your data needs more cleaning than what Data Interpreter can help you with, try Tableau Prep(Link opens in a new window).
Turn on Data Interpreter and review results
-
From the Connect pane, connect to an Excel spreadsheet or other connector that supports Data Interpreter such as Text (.csv) files, PDF files or Google sheets.
-
Drag a table to the canvas (if needed), then on the Data Source page, in the left pane, select the Use Data Interpreter check box to see if Data Interpreter can help clean up your data.

Note: When you clean your data with Data Interpreter, Data Interpreter cleans all the data associated with a connection in the data source. Data Interpreter does not change the underlying data.
-
In the Data pane, click the Review the results link to review the results of the Data Interpreter.
A copy of your data source opens in Excel on the Key for the Data Interpreter tab. Review the key to find out how to read the results.

-
Click each tab to review how Data Interpreter interpreted the data source.
If Data Interpreter found additional tables, also called found tables or sub-tables, they are identified in the <sheet name>_subtables tab by outlining their cell ranges. A separate tab is also included for each sub-table, color coded to identify the header and data rows.
If Data Interpreter does not provide the expected results, clear the Cleaned with Data Interpreter check box to use the original data source.

-
To replace the current table with any of the found tables, drag the current table off the canvas and then drag the found table that you want to use to the canvas.
If Data interpreter has misidentified the range of the found table, after you drag the found table to the canvas, click the drop-down arrow on that table, and then select Edit Found Table to adjust the corners of the found table (the top-left cell and bottom-right cell of the table).

-
After you have the data that you want to work with, you can apply any additional cleaning operations to your data so that you can analyze it.
Data Interpreter Example
In this example we are connecting to an Excel spreadsheet with violent crime data by city and state for the year 2016. This spreadsheet includes multiple tables on one sheet and some extra formatting.

-
Title
-
Merged header cells
-
Extra white space
-
Sub-tables
The extra formatting in this spreadsheet makes it difficult for Tableau to determine what the field headers and values are.
Instead, it reads the data vertically and assigns each column the default value F1, F2, F3 (Field 1, Field 2, Field 3) and so on. Blank cells are read as null values.

To see if Data Interpreter can help clean this data set, we select Use Data Interpreter.
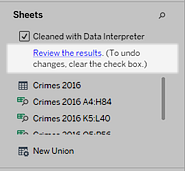
Data Interpreter detected the proper headings for the fields, removed the extra formatting and found several sub-tables. The sub-tables are listed in the Sheets section in the Data pane and are named using the original sheet name and the cell ranges for each sub-table.
In this example there are three sub-tables: Crimes 2016 A4:H84, Crimes 2016 K5:L40, and Crimes 2016 O5:P56.

To examine the results of the Data Interpreter more closely, we click the Review the results link in the Data pane to view an annotated copy of the spreadsheet.
Here we see a copy of the original data, color coded to identify which data was identified as header data and which data was identified as field values.

The next tab shows us the sub-tables that Data Interpreter found, outlined by the cell ranges.

In this example the first sub-table, Crimes 2016 A4:H84, has the main data that we want to work with. To use this table as our data table, we can simply drag the original table off the canvas and then drag the new table to the canvas.

Once we have the data that we want to work with in the canvas, we can do some additional clean up on the data. For example we can:
-
Change the field names so that they represent city, state, and month names.
-
Pivot the months fields.
-
Drag in the third sub-table Crimes 2016 o5:P56 and join it to our first sub-table on the State field to include state populations for our analysis.
-
Hide any duplicate fields that were added as a result of the join.
The results might look something like this:

Now we are ready to start analyzing our data in Tableau.
When Data Interpreter is not available
The Data Interpreter option might not be available for the following reasons:
-
The data source is already in a format that Tableau can interpret: If Tableau Desktop doesn't need extra help from Data Interpreter to handle unique formatting or extraneous information, the Data Interpreter option is not available.
-
Many rows or many columns: The Data Interpreter option is not be available when your data has the following attributes:
-
Data contains more than 2000 columns.
-
Data contains more than 3000 rows and more than 150 columns.
-
-
The data source is not supported: Data Interpreter is only available for Microsoft Excel, Text (.csv) files, PDF files and Google Sheets. For Excel, your data must be in the .xls or .xlsx format.