Build a Treemap
Use treemaps to display data in nested rectangles. You use dimensions to define the structure of the treemap, and measures to define the size or color of the individual rectangles. Treemaps are a relatively simple data visualization that can provide insight in a visually attractive format.
The basic building blocks for a treemap are as follows:
- Mark type: Automatic or Square
- Color: Dimension or Measure
- Size: Measure
- Label or Detail: Dimension(s)
To create a treemap that shows aggregated sales totals across a range of product categories, follow the steps below.
- Connect to the Sample - Superstore data source (if necessary, you can download it from the Tableau Public sample data page(Link opens in a new window)).
- Drag the Sub-Category dimension to Columns.
A horizontal axis appears, which shows product categories.
- Drag the Sales measure to Rows.
Tableau aggregates the measure as a sum and creates a vertical axis, making a bar chart—the default chart type when there is a dimension on the Columns shelf and a measure on the Rows shelf.
- Click Show Me on the toolbar, then select the treemap chart type.
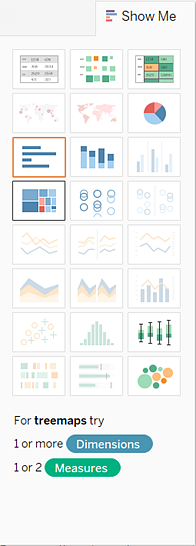
Tableau displays the following treemap:
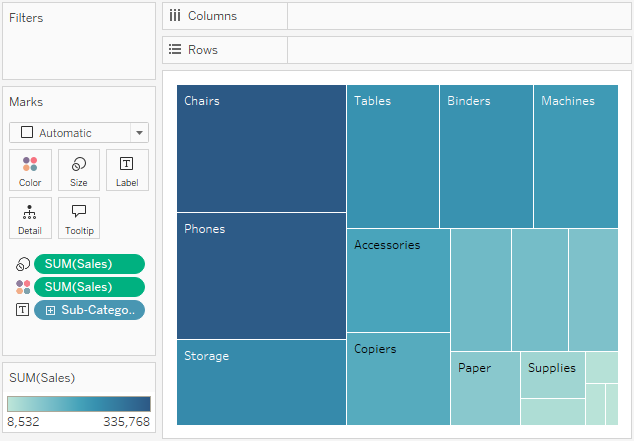
In this treemap, both the size of the rectangles and their color are determined by the value of Sales—the greater the sum of sales for each category, the darker and larger its box.
- Drag the Ship Mode dimension to Color on the Marks card. In the resulting view, Ship Mode determines the color of the rectangles—and sorts them into four separate areas accordingly. Sales determines the size of the rectangles:

- Try another option to modify the treemap: click the Undo button to remove Ship Mode from view.
- Drag the Profit measure to Color on the Marks card. Now Profit determines the color of the rectangles, and Sales determines their size:
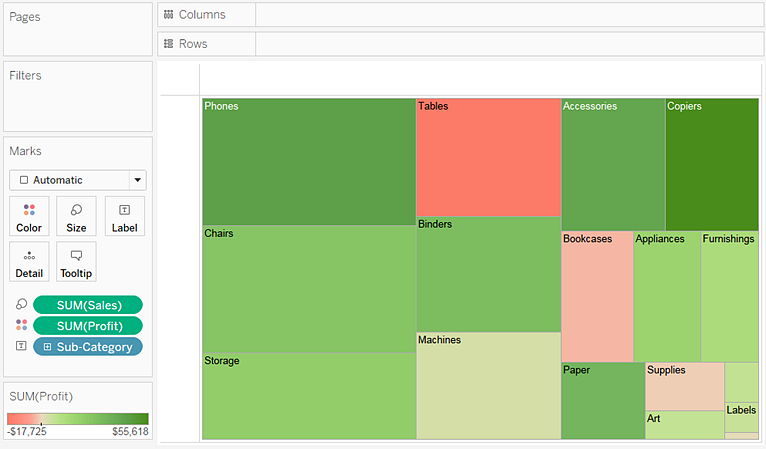
With treemaps, Size and Color are the crucial elements. You can place measures on Size and Color, but placing a measure anywhere else has no effect. Treemaps can accommodate any number of dimensions, including one or even two on Color. But beyond that, adding dimensions only breaks the map into an ever greater number of smaller rectangles. For information on how to place two dimensions on Color in a treemap, see Example – Multiple Fields on Color.