Build a Text Table
In Tableau, you typically create text tables (also called cross-tabs or pivot tables) by placing one dimension on the Rows shelf and another dimension on the Columns shelf. You then complete the view by dragging one or more measures to Text on the Marks card.
A text table uses the text mark type. Tableau uses this mark type automatically if the view is constructed using only dimensions (assuming the mark type is set to Automatic). For more information about the text mark type, see Text mark.
Build a text table with raw values
To create a text table that shows sales totals by year and category, follow these steps:
- Connect to the Sample - Superstore data source (if necessary, you can download it from the Tableau Public sample data page(Link opens in a new window)).
- Drag the Order Date dimension to Columns.
Tableau aggregates the date by year and creates column headers.
- Drag the Sub-Category dimension to Rows.
Tableau creates row headers. Columns with headers plus rows with headers means that a valid table structure now exists. For more information about changing the layout for row and column headers, see Define Table Structure.
Now you can add a measure to the view to see actual data.
-
Drag the Sales measure to Text on the Marks card.
Tableau aggregates the measure as a sum.
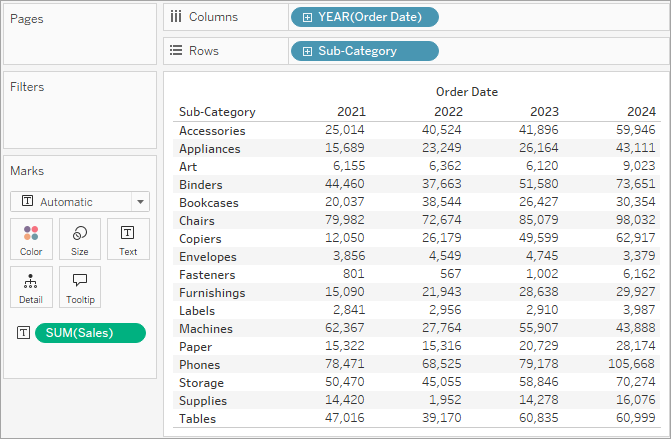
Tableau uses text as the mark type. Each cell in the table displays the sum of sales for a particular year and sub-category. We can see that the chairs and phones sub-categories had the highest sales in every year.
- Drag the Region dimension to Rows and drop it to the left of Sub-Category. A small triangle will appear to indicate that the new field will be inserted to the left of the existing field.
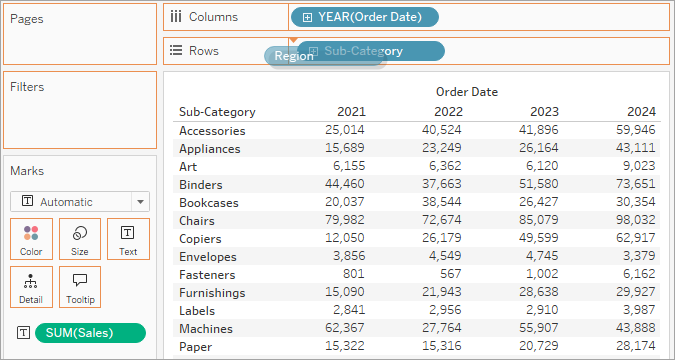
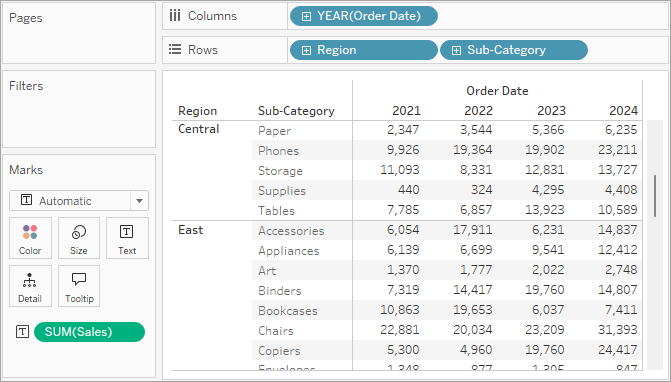
The view now breaks out sales by region, in addition to year and sub-category. Regions are listed alphabetically.
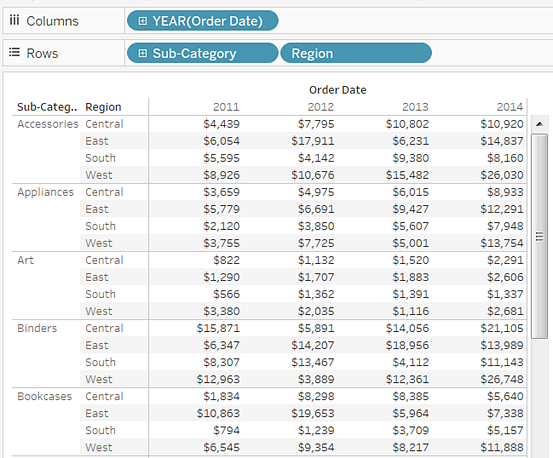
You can drag Region to the right of Sub-Category to organize the view first by sub-category, and then by region.
Change the values to percentages
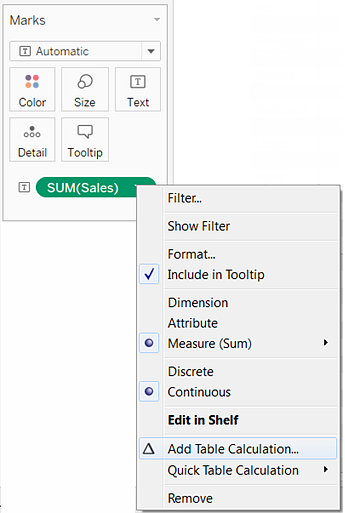
- To create a table calculation to show percentages, right-click (control-click on Mac) the SUM(Sales) field on the Marks card, and then select Add Table Calculation.
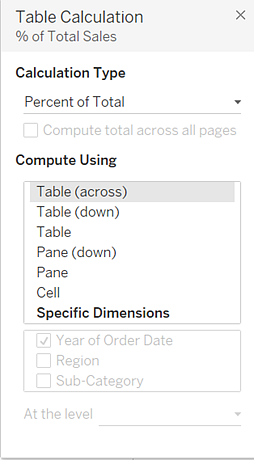
- In the Table Calculation dialog box, set Calculation Type to Percent of Total.
The options in the dialog box change depending on the type of calculation you choose. For more information about using table calculations, see Transform Values with Table Calculations.
- For the Calculation definition, select Pane (Down), and then close the Table Calculation dialog box.
Now we see percentages calculated within each region, per year within each sub-category. The numbers within each pane (the highlighted area) add up to 100%.
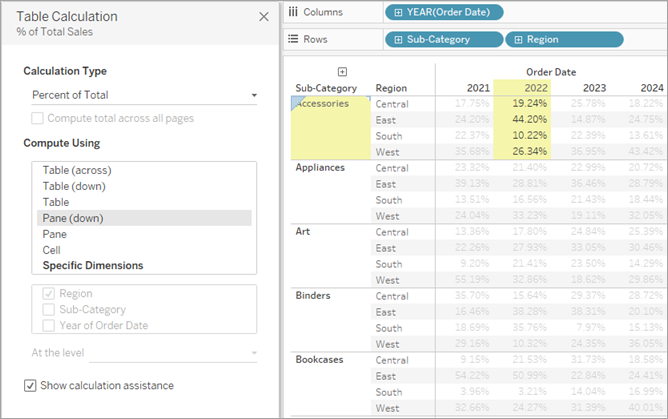
Pane (Down) is the appropriate choice because it specifies that the calculation should be performed vertically within each pane of the table, or per year.
The table has two vertical dimensions, so Table (Down) would have calculated the percent of total from top to bottom for the entire table, ignoring the Sub-Category dimension:
")
Pane would compute across the pane, computing across the years:
