Transform Values with Table Calculations
This article explains the basics of table calculations and how to create them in Tableau.
What is a table calculation?
A table calculation is a transformation you apply to the values in a visualization. Table calculations are a special type of calculated field that computes on the local data in Tableau. They are calculated based on what is currently in the visualization and do not consider any measures or dimensions that are filtered out of the visualization.
You can use table calculations for a variety of purposes, including:
- Transforming values to rankings
- Transforming values to show running totals
- Transforming values to show percent of total
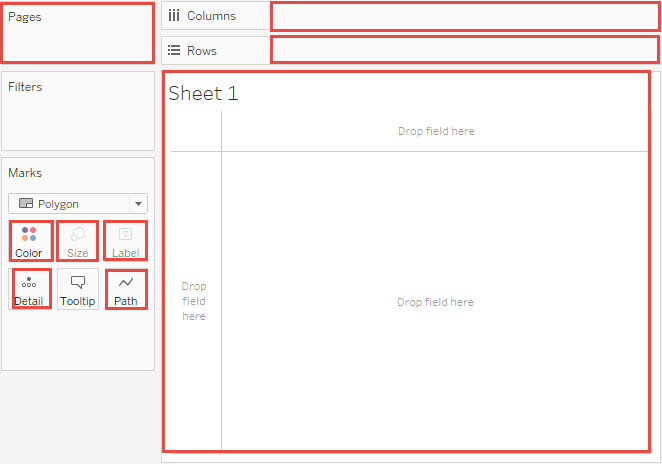
For any Tableau visualization, there is a virtual table that is determined by the dimensions in the view. This table is not the same as the tables in your data source. Specifically, the virtual table is determined by the dimensions within the “level of detail,” which means the dimensions on any of the following shelves or cards in a Tableau worksheet:
The basics: addressing and partitioning
When you add a table calculation, you must use all dimensions in the level of detail either for partitioning (scoping) or for addressing (direction).
The dimensions that define how to group the calculation (the scope of data it is performed on) are called partitioning fields. The table calculation is performed separately within each partition.
The remaining dimensions, upon which the table calculation is performed, are called addressing fields, and determine the direction of the calculation.
Partitioning fields break the view up into multiple sub-views (or sub-tables), and then the table calculation is applied to the marks within each such partition. The direction in which the calculation moves (for example, in calculating a running sum, or computing the difference between values) is determined by the addressing fields. So when you order the fields in the Specific Dimensions section of the Table Calculation dialog box from top to bottom, you are specifying the direction in which the calculation moves through the various marks in the partition.
When you add a table calculation using the Compute Using options, Tableau identifies some dimensions as addressing and others as partitioning automatically, as a result of your selections. But when you use Specific Dimensions, then it’s up to you to determine which dimensions are for addressing and which for partitioning.
Table (across)
Computes across the length of the table and restarts after every partition.
For example, in the following table, the calculation is computed across columns (YEAR(Order Date)) for every row (MONTH(Order Date)).

Table (down)
Computes down the length of the table and restarts after every partition.
For example, in the following table, the calculation is computed down rows (MONTH(Order Date)) for every column (YEAR(Order Date)).

Table (across then down)
Computes across the length of the table, and then down the length of the table.
For example, in the following table, the calculation is computed across columns (YEAR(Order Date)), down a row (MONTH(Order Date)), and then across columns again for the entire table.

Table (down then across)
Computes down the length of the table, and then across the length of the table.
For example, in the following table, the calculation is computed down rows (MONTH(Order Date)), across a column (YEAR(Order Date), and then down rows again.

Pane (down)
Computes down an entire pane.
For example, in the following table, the calculation is computed down rows (MONTH(Order Date)) for a single pane.

Pane (across then down)
Computes across an entire pane and then down the pane.
For example, in the following table, the calculation is computed across columns (YEAR(Order Date)) for the length of the pane, down a row (MONTH(Order Date)), and then across columns for the length of the pane again.

Pane (down then across)
Computes down an entire pane and then across the pane.
For example, in the following table, the calculation is computed down rows (MONTH(Order Date)) for the length of the pane, across a column (YEAR(Order Date)), and then down the length of the pane agian.

Cell
Computes within a single cell.

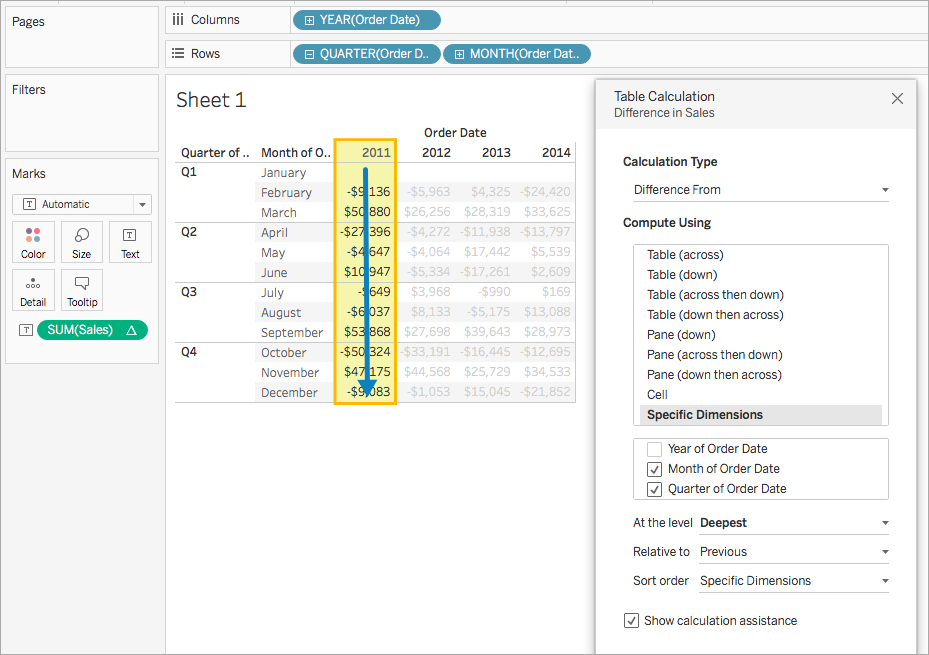
Specific Dimensions
Computes only within the dimensions you specify.
For example, in the following visualization the dimensions, Month of Order Date and Quarter of Order Date, are the addressing fields (since they are selected), and Year of Order Date is the partitioning field (since it is not selected). So the calculation transforms the difference from each month across all quarters within a year. The calculation starts over for every year.
Note that if all dimensions are selected, then the entire table is in scope.
At the level
The At the level option is only available when you select Specific Dimensions in the Table Calculations dialog box, and when more than one dimension is selected in the field immediately below the Compute Using options —that is, when more than one dimension is defined as an addressing field.
This option is not available when you’re defining a table calculation with Compute Using, because those values establish partitions by position. But with Specific Dimensions, because the visual structure and the table calculation are not necessarily aligned, the At the level option is available to let you fine-tune your calculation.
Use this setting to set a break (that is, restart of the calculation) in the view, based on a particular dimension. How is this different from just using that dimension for partitioning? In fact, it is partitioning, but it’s partitioning by position rather than by value, which is how partitioning is defined with the Compute Using options.
The choices available from the At the level drop-down list in the example above are:
| Deepest | Specifies that the calculation should be performed at the level of finest granularity. This is the default option. |
| Quarter of Order Date | Specifies that the calculation should be performed at the quarter level. |
| Month of Order Date |
Specifies that the calculation should be performed at the month level.
|
Create a table calculation
To learn how to create a table calculation, follow along with the steps in the example below. To learn how to create quick table calculations, see Quick Table Calculations.
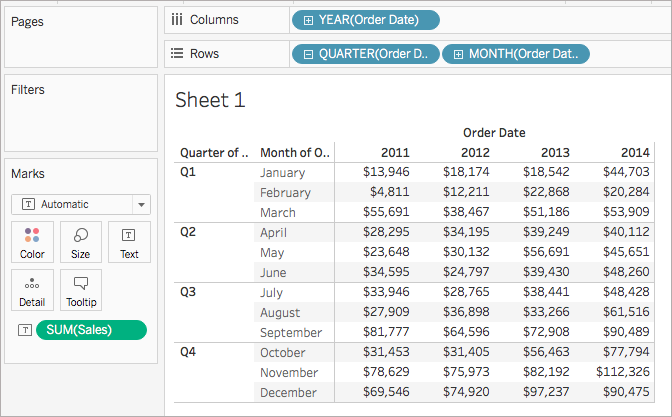
Step 1: Build the visualization
- Open Tableau and connect to the Sample-Superstore saved data source.
- Navigate to a new worksheet.
- From the Data pane, drag Order Date to the Rows shelf. The dimension updates to YEAR(Order Date).
- On the Rows shelf, right-click YEAR(Order Date) and select Quarter.
- On the Rows shelf, click the + icon on QUARTER(Order Date). MONTH(Order Date) is added to the shelf.
- From the Data pane, under Dimensions, drag Order Date to the Columns shelf. The dimension updates to YEAR(Order Date) again.
- From the Data pane, drag Sales to Text on the Marks card.
Step 2: Add the table calculation
- On the Marks card, right-click SUM(Sales) and select Add Table Calculation.
- In the Table Calculation dialog box that opens, do the following:
- For Calculation Type: select Difference From.
For more information about the types of table calculations you can use in Tableau, and how you can configure them, see Table Calculation Types. - For Compute Using, select Table (across). Note that as you select how to compute the calculation, the visualization updates with visual indicators to guide you.
For more information about these options, see The basics: addressing and partitioning section. - When finished, click the X in the top corner of the Table Calculation dialog box to exit it.
The calculation is applied to the values in the visualization.
Check your work!

Edit a table calculation
To edit a table calculation:
- Right-click the measure in the view with the table calculation applied to it and select Edit Table Calculation.
- In the Table Calculation dialog box that appears, make your changes.
- When finished, click the X in the top corner of the Table Calculation dialog box to exit it.
Remove a table calculation
To remove a table calculation:
- Right-click the measure in the view with the table calculation applied to it and select Clear Table Calculation. The table calculation is removed from the measure and the visualization updates with the original values.