Interact with Data on Tableau Mobile
Using Tableau Mobile, you can interact with views and metrics that are published on Tableau Server and Tableau Cloud.
Stay up to date with your Tableau Pulse metrics
Note: Tableau Pulse is available exclusively for Tableau Cloud. If you don’t see Tableau Pulse, ask your administrator to turn it on for your site. For more information about Tableau Pulse, see About Tableau Pulse.
Access the Tableau Pulse metrics that you follow on Tableau Mobile and see insights about your data whenever you need them. Tableau Pulse is available for Tableau Cloud and combines a metrics layer, where members of your organisation define key numbers to track, with an insights platform that informs you about trends, outliers and other changes to those metrics. For information about using Tableau Pulse on Tableau Cloud, see Explore Metrics with Tableau Pulse and Create Metrics with Tableau Pulse.
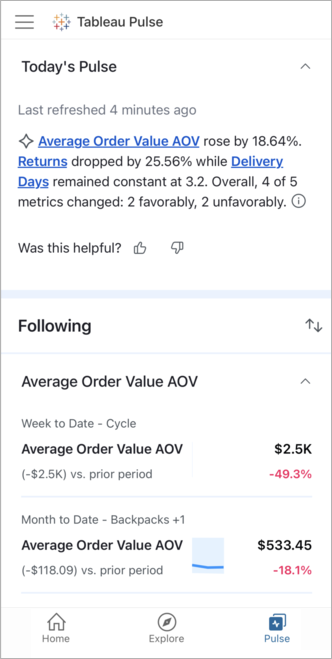
To open Tableau Pulse, from the navigation bar, select Pulse. When you open Tableau Pulse, you see a summary of the top insights for your metrics, along with a feed of all the metrics that you follow. The insights and metrics presented on this screen are stored offline, so you can see the most recent values for your metrics even if you don’t have a connection. If you don't see an offline preview, your administrator might have turned off these previews.
You won’t see metrics if you don’t follow any. To find metrics to follow, sign in to Tableau Cloud with a web browser, and visit Tableau Pulse to browse all the metrics on your site. For more information, see Get started with Tableau Pulse. If you have a Creator, Site Administrator Explorer, or Explorer (can publish) site role, you can also create metric definitions on Tableau Cloud. For more information, see Create a metric definition.
Explore insights
Tap a metric to open its insights exploration screen. Any metrics that you select in a Slack or email digest automatically open to the insights exploration screen in Tableau Mobile as well. On the insights exploration screen, you can switch between the overview tab, which shows the value for the metric during the current period, and the breakdown tab, which shows how different dimensions are contributing to the value.

Below the overview and breakdown section, select from suggested questions to learn more about the factors driving changes in your data. If there are any unusual changes to your data, Tableau Pulse also presents them here.

Adjust filters for metrics
- Open the metric that you want to filter.
- Select the edit icon next to the current filters.
- Adjust the time period and select fields to filter for the dimensions listed.
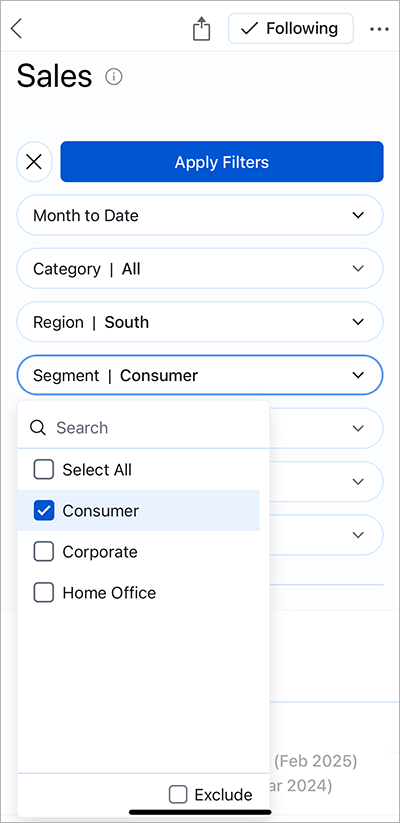
- Select Apply Filters.
Each metric in Tableau Pulse represents a unique combination of the time range and filters. When you filter a metric, Tableau Pulse creates a new metric with those filters applied if one doesn’t already exist. Followers from the previous metric don’t carry over to the new metric. To track the new metric in your email and Slack digests and on your Tableau Pulse tab, follow it.
Manage followers
The followers of a metric see that metric on their Tableau Pulse home and in Slack and email digests.
Add followers
- On the metric that you want to manage, select the Actions (...) menu.
- Select Manage Followers.
- Enter the user or group names that you want to add. Then select Add.
If you add users to a metric as part of a group, they won’t be able to remove themselves individually. To give users control over the metrics they follow, add them as individuals.
Remove followers
- On the metric that you want to manage, select the Actions (...) menu.
- Select Manage Followers.
- Swipe left on the name that you want to remove. Then select Remove.
Share metrics
To share a link to a metric, tap the share icon at the top of the screen. This button opens the sharing options for your mobile device. Tableau Pulse doesn’t currently support the share with people via Tableau option described under Share content.

Customise the Pulse tab
You can customise the Tableau Mobile Pulse tab by sorting and grouping metrics. Sort metrics based on how recently you followed the metric, or group metrics that share a metric definition or a data source.
- From the Pulse tab, select the sort icon.

- Select how you want your metrics to be sorted, for example, grouped by metric definition and ordered ascending.
- Select Apply to use this sort order just on Tableau Mobile, or select Set Default Order to also apply this sort order to your Tableau Pulse web home page, Slack digest and email digest.
Check your alerts
You receive an alert when a metric that you’re following crosses into an unfavourable threshold range or has a new unfavourable trend. For more information about alerts, see Get Tableau Pulse Alerts.
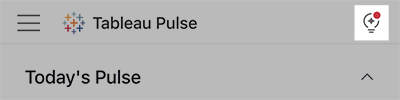
- On the Pulse tab, select the alerts icon in the upper-right corner.
- The All Alerts tab shows alerts from the past 24 hours. To see metrics that you’ve turned off alerts for, select the Alerts Off tab.
Manage alerts for a metric
You can control whether you receive alerts for individual metrics.
Turn alerts off
- On the All Alerts tab, swipe left on a metric.
- Select Turn Off. This option turns off all alerts for that metric.
Turn alerts on
- On the Alerts Off tab, swipe left on a metric.
- Select Turn On.
Configure the Tableau widget to show metrics on your home screen
The Tableau widget shows up to two of your favourite Pulse metrics. To learn about adding widgets on your device, see Add, edit and remove widgets on iPhone(Link opens in a new window) in the iPhone User Guide and Add apps, shortcuts & widgets to your Home screens(Link opens in a new window) in the Android Help.
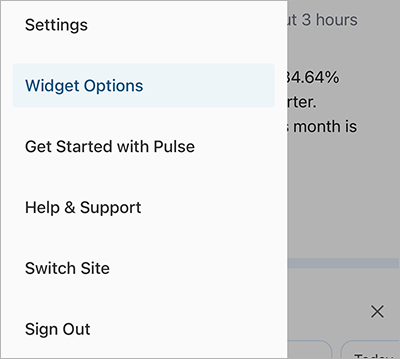
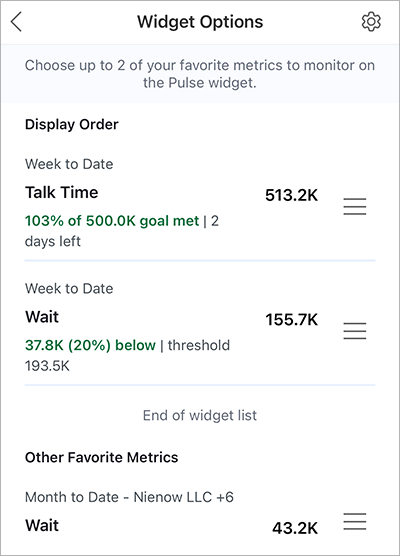
- From the Tableau Mobile navigation panel, select Widget Options.
- The metrics under Display Order appear on the widget. The metrics below the widget list are the rest of your favourite metrics. Select the ≡ icon to move a metric to the top or bottom. If you don’t see any metrics on this screen, add metrics that you follow to your favourites by selecting the star icon on a metric.
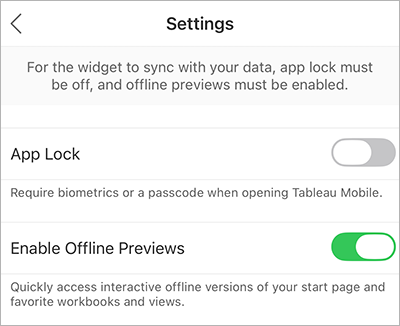
- In the upper right corner of the Widget Options, select the settings icon.
- Toggle off App Lock, and toggle on Enable Offline Previews. These settings must be configured in this way for the Tableau widget to sync with your data. If these settings are admin enabled or disabled, contact your Tableau admin for help.
Hide and show Tableau Pulse recommendations
The recommendations section on the Pulse tab shows trending metrics. You can choose to hide or show this section.
- To hide the recommendations section, on the Pulse tab select the X on the Recommendations for You card.
- To bring back the recommendations section, open the Tableau Mobile settings, then select Show Pulse Recommendations.
Interact with offline workbooks and views
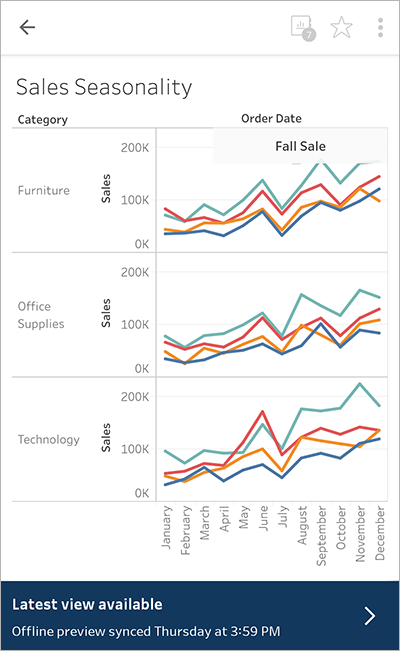
Tableau Mobile stores interactive previews of workbooks and views that you can access when you’re offline. That way, if you’re travelling and have no connection, you can still see your data. These previews display the last time they synced, so you know how fresh they are.
Previews are generated for workbooks and views set as your start page, workbooks and views in your favourites, and workbooks and views that are in collections that you've added to your favourites.
Previews let you scroll, pan and zoom a viz, see data tooltips and highlight marks. However, the following features aren't available: filtering, combined tooltips for multiple selected marks, Viz-in-Tooltip and advanced analytics like trend and reference lines.
When you’re online, these previews display while the latest view loads. After it has finished loading, you’ll automatically transition from the preview to the latest view. If you interact with the preview, you won’t transition, so you don’t lose any analysis that you’ve done. When you're ready to see the latest view, select the arrow in the footer to transition.
If the view can’t load, an error message displays with the option to see error details. Make sure you have a connection and are on your corporate VPN, if necessary, to load the latest view.
You can turn interactive previews on or off in the app settings. Be aware that Tableau Server administrators sometimes disable interactive previews for entire organisations. Particularly complex views might render as images even if interactive previews are supported. Your administrator can change the complexity threshold. If you frequently see static images, ask your Tableau administrator to adjust client-side rendering settings.
Adjust and compare metrics (retired)
Retirement of the legacy metrics feature
Tableau's legacy metrics feature was retired in Tableau Cloud in February 2024 and in Tableau Server version 2024.2. In October 2023, Tableau retired the ability to embed legacy metrics in Tableau Cloud and in Tableau Server version 2023.3. With Tableau Pulse, we've developed an improved experience to track metrics and ask questions of your data. For more information, see Create Metrics with Tableau Pulse to learn about the new experience and Create and Troubleshoot Metrics (Retired) for the retired feature.
This section refers to the legacy metrics feature. For information about Tableau Pulse metrics on Tableau Mobile, see Stay up to date with your Tableau Pulse metrics.
Metrics help you track data for key numbers, like weekly sales. Optimised for mobile devices, metrics are easy to understand at a glance. For more about metrics, see Create and Troubleshoot Metrics.
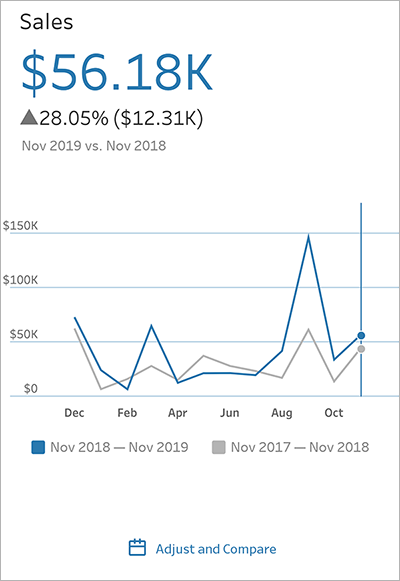
Metrics have a feature available only on Tableau Mobile that allows you to adjust the date range displayed on the metric's timeline and change the comparison. These adjustments let you focus on the most important data.
- Open a metric and select the Adjust and Compare button. This button appears only for metrics with a timeline.
- Under Date Range, select the range you want to display on the timeline.
- Under Compare Versus, select the date you want to compare the current value to, or select No comparison. This affects the change value shown below the metric value.
- To display a comparison line on the metric timeline, toggle Show comparison line to on.
- Select the back button to see your changes applied to the metric.
Metrics display data from their owner’s perspective
When you look at a metric, the numbers displayed for a measure might be different from the numbers you see on the connected view. This is because some views filter data based on the viewer's credentials. The owner's credentials are used when getting the data for a metric, so you see the data from the owner's perspective.
Share content
When you share content directly with other users via Tableau, they receive a notification with a link to that content, and the content is also added to Shared with Me, so they can easily find it later. Notifications can come by email, the in-app notifications centre and in the Tableau for Slack app if the site is connected to a Slack workspace.
To share directly via Tableau:
- On the content you want to share, select the share icon.
- Select With People via Tableau. Tableau Pulse metrics don't support the share with people via Tableau option.

- Enter the name or username for the person you want to share with, then select the user from the list. This person must have an account on your Tableau site.
- Select the send arrow.
The sharing options listed under Other Options allow you to copy the link to the content or send the link via other third-party apps you have installed, but they don't send a notification in the Tableau or Slack app, and the content won't appear in the recipient's Shared with Me.
Sharing in Tableau doesn't grant the recipient permission to view the shared content. Users can request access to content they don't have permission to view, if request access is turned on for your site. Permissions can't be configured in Tableau Mobile; instead, use Tableau Cloud or Tableau Server in a web browser. For more information, see Permissions.
Link from one view to another
Links from one Tableau view to another open directly in Tableau Mobile rather than in a browser, so you don't need to switch back to the app. You'll particularly appreciate this if your organisation uses groups of dashboard links that help you navigate to other Tableau content.
Open external links to views and metrics
If someone sends you a link to a view or metric, or if you receive a notification email with a link, you can open the link directly in Tableau Mobile. Simply select the link, and it will either open in the app or open in a web browser and automatically redirect to the app. If a prompt appears asking you for permission to open the link in Tableau Mobile, accept the prompt.
If you open a link for a version of Tableau Server earlier than 2020.2, or if your Tableau administrator has turned off this feature, the link won't automatically open in the app. Instead, the link will open in a web browser, and you can select the Open in Tableau Mobile banner to open it in the app.
For more information, see Control deep linking for Tableau Mobile(Link opens in a new window).