Build a Bullet Graph
A bullet graph is a variation of a bar graph developed to replace dashboard gauges and meters. A bullet graph is useful for comparing the performance of a primary measure to one or more other measures. It consists of one measure forming the bars and a second measure represented as a reference line with distribution bands. For more information on how to construct or read a bullet graph, see Bullet Graphs on Tableau's website. Below is a single bullet graph showing how inbound tourism compares to outbound tourism.
The basic building blocks for a bullet graph are as follows:
- Mark type: Bar (or automatic)
- Columns shelf: First measure
- Rows shelf: Dimension
- Detail and reference line with distribution bands: Second measure
Follow these steps to create a bullet graph:
- Connect to the World Indicators data source.
- Navigate to a new worksheet.
- In the Data pane, in the Development folder, multi-select the fields Tourism Inbound and Tourism Outbound (hold down the Shift key to select multiple fields).
- In the top right of the toolbar, select Show Me.
- In Show Me, choose Bullet Graph.
- Click Show Me again to close it.
- From the Data pane, drag Region to the Rows shelf.
The graph updates to look like the following:

Check your work! Watch steps 3 - 7 below:
Note: In Tableau 2020.2 and later, the Data pane no longer shows Dimensions and Measures as labels. Fields are listed by table or folder.
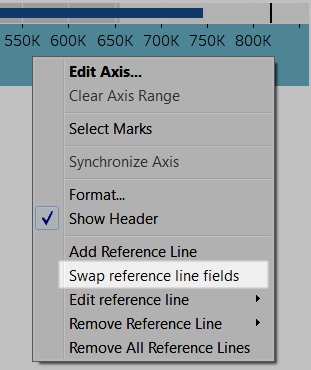
Swap reference line fields
Sometimes you might want to swap the reference lines fields. For example, the inbound tourism is shown as a reference distribution instead of a bar.
To swap the two measures, right-click (control-click on the Mac) the axis and select Swap Reference Line Fields.
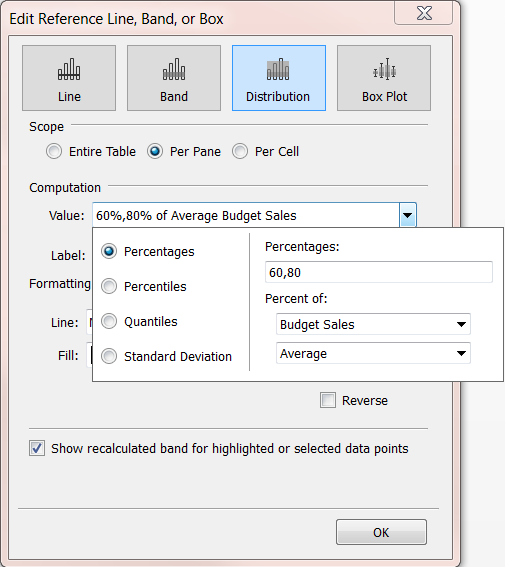
Edit the distribution
Right-click (control-click on the Mac) the axis in the view and select Edit Reference Line, and then select one of the reference lines to modify.