Create an Area Chart
An area chart is a line chart where the area between the line and the axis are shaded with a color. These charts are typically used to represent accumulated totals over time and are the conventional way to display stacked lines.
The basic building blocks for an area chart are as follows:
- Mark type: Area
- Columns shelf: Dimension
- Rows shelf: Measure
- Color: Dimension
You can create an area chart with discrete or continuous dimensions.
-
Continuous dimensions visualize data with a linear, continuous axis. These charts are useful for displaying trends and proportional changes, especially when data points aren't evenly spaced.
-
Discrete dimensions visualize data with discrete, categorical headers. These charts are helpful for showing incremental data, such as fiscal periods.
To learn more about discrete and continuous data types, see Dimensions and Measures, Blue and Green.
To create an area chart, follow these steps:
- Connect to the Sample - Superstore data source (if necessary, you can download it from the Tableau Public sample data page(Link opens in a new window)).
- Navigate to a new worksheet.
- From the Data pane, drag Order Date to the Columns shelf.
- On the Columns shelf, right-click YEAR(Order Date) and select Month.

- From the Data pane, drag Quantity to the Rows shelf.
- From the Date pane, drag Ship Mode to Color on the Marks card.
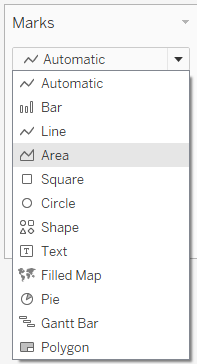
- On the Marks card, click the Mark Type drop-down and select Area.
The visualization updates to the following:

You can add formatting to an area chart. For example, you can edit the color legend and turn on mark labels and borders. For more information, see Format at the Worksheet Level(Link opens in a new window).
You can also use highlight actions with area charts. For example, selecting a color in the legend or turning on the highlighter will highlight the entire area instead of just the line. For more information, see Highlight Actions.