Text File
This article describes how to connect Tableau to text file data and set up the data source. Tableau connects to delimited text files (*.txt, *.csv, *.tab, *.tsv).
Make the connection and set up the data source
-
After you open Tableau, under Connect, click Text File.
-
Select the file you want to connect to, and then click Open.
NOTE: Beginning with Tableau 2020.2, legacy Excel and Text connections are no longer supported. See the Legacy Connection Alternatives document in Tableau Community for alternatives to using the legacy connection.
-
On the data source page, do the following:
-
(Optional) Select the default data source name at the top of the page, and then enter a unique data source name for use in Tableau. For example, use a data source naming convention that helps other users of the data source figure out which data source to connect to. The default name is automatically generated based on the file name.
-
Click the sheet tab to start your analysis.
Use custom SQL to connect to a specific query rather than the entire data source. For more information, see Connect to a Custom SQL Query.
Note: For text files, custom SQL is available only when using the legacy connection or in workbooks that were created before Tableau Desktop 8.2.
-
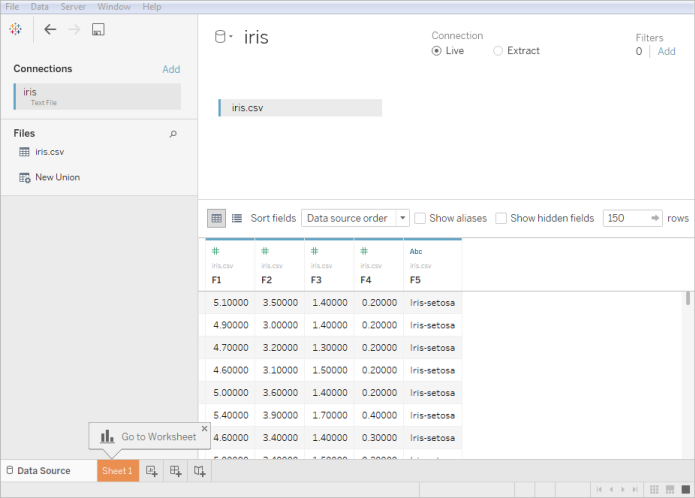
Text file data source example
Here is an example of a text file data source:
Optional settings
You can set the following options before building the view.
Get more data
Get more data into your data source by adding more tables or connecting to data in a different database.
-
Add more data from the current file: From the left pane, drag additional tables to the canvas to combine data using a join or union. For more information, see Join Your Data or Union Your Data.
-
Add more data from different databases: In the left pane, click Add next to Connections. For more information, see Join Your Data.
If a connector you want is not listed in the left pane, select Data > New Data Source to add a new data source. For more information, see Blend Your Data.
Clean your data with Data Interpreter
If Tableau detects that it can help optimize your data source for analysis, it prompts you to use Data Interpreter. Data Interpreter can detect sub-tables that you can use and remove unique formatting that might cause problems later on in your analysis. For more information, see Clean Data from Excel, CSV, PDF, and Google Sheets with Data Interpreter.
Set text file options
On the canvas, click the table drop-down arrow and then select whether the first row contains column names. This option is selected by default. Alternatively, you can have Tableau generate names when you connect. These names can be changed later. You can also select Text file properties to specify the following:
-
Select the character that is used to separate the columns. Select from the list of characters or select Other to type in a custom character.
-
Select the text qualifier that encloses values in the text file.
-
Select a character set that describes the text file encoding. The available encodings are based on the operating system you are using. For example, on Windows, ANSI is listed as windows-1252 and OEM is listed as 437.
Note: In workbooks created prior to Tableau Desktop 8.2 or that use the legacy connection, you can select ANSI, OEM, UTF-8, UTF-16, or Other. When you select Other, you must specify the character set in the provided text field. This value is verified when the connection is attempted.
-
Select the locale by which the file should be parsed. This option tells Tableau which decimal and thousands separator to use.
Review the data, pivot, split, and create calculations
The first 1,000 rows of the data in the data source are automatically displayed below the canvas in the data grid. If you add tables, remove tables, or make changes to the join conditions, the data grid updates with your changes. You can also do the following in the data grid:
-
Change the data type or geographical role of a column by clicking the data type icon.
-
Hide a field by clicking the column drop-down arrow and selecting Hide.
-
Rename a field by double-clicking the field name.
-
Reset a field name by clicking the column drop-down arrow and selecting Reset Name.
-
Sort fields in both the data grid and metadata grid by selecting a sort option from the Sort fields drop-down list.
-
Sort rows in the data grid by clicking the sort button next to the column name.
-
Pivot fields to transform data in a crosstab format into a columnar format. This is only available for non-legacy connection types. For more information, see Pivot Data from Columns to Rows.
-
Split a string field into multiple fields. This is only available for non-legacy connection types. For more information, see Split a Field into Multiple Fields.
-
Create new calculations based on existing field in the Tableau data source. Click the column drop-down arrow and select Create Calculated Field.
-
Copy values in the grid by selecting the values and then pressing Ctrl+C (Command-C on a Mac). Alternatively, to copy values in the metadata grid, select the values, right-click (Control-click on a Mac), and then select Copy.
Examine the data source structure and perform management tasks
Use the metadata area to quickly examine the general structure of the Tableau data source and its fields. If you are working with a particularly large data source, use the metadata area to perform routine data management tasks such as hide multiple fields at once or quickly rename or reset fields.
Connect live or use an extract
At the top of the Data Source page, select Live or Extract mode. If you choose to create an extract, the Edit link displays. Click Edit to set up filters that define a subset of the data that you want to include in the extract. For more information, see Extract Your Data.
Add data source filters
At the top of the data source page, click Add to add data source filters to control what data is used in included in the data source and therefore restrict the visibility and use of the fields in the data source.
Best practices
Collect files in a single directory
Collect all relevant text files for a multi-table connection in a single directory, with nothing else in that directory, so that users cannot inadvertently select a file that is not appropriate for the connection.
Text file column width and size considerations
If the text file contains columns that are more than 254 characters wide, Tableau cannot use these fields for workbooks that were created before Tableau Desktop 8.2 or that use the legacy connection. Either remove the columns, modify them to fit within 254 characters prior to connecting in Tableau, or upgrade the text file data source.
Large text files often perform poorly as a data source, because the queries can take a long time.
About .ttde and .hhyper files
You might notice .ttde or .hhyper files when navigating your computer's directory. When you create a Tableau data source that connects to your data, Tableau creates a .ttde or .hhyper file. This file, also known as a shadow extract, is used to help improve the speed your data source loads in Tableau Desktop. Although a shadow extract contains underlying data and other information similar to the standard Tableau extract, a shadow extract is saved in a different format and can't be used to recover your data.
Note: .tde files are no longer supported for Tableau versions beyond 2024.2. All extracts are now in .hyper format.
See also
- Set Up Data Sources – Add more data to this data source or prepare your data before you analyze it.
- Build Charts and Analyze Data – Begin your data analysis.