Understand Tooltips for Multi-fact Relationship Data Models
Note: For single table data sources or single-base table data sources, all the tables are related. Everything on this page refers to multiple base table data sources.
Field-level relatedness
Data models with multiple base tables have a lot of flexibility in how the tables can relate—or not relate—to each other. The relatedness of the tables is a constant based on the data model. However, the relatedness of fields in a viz depends on what fields are active (that is, what fields are in use on the worksheet shelves as pills). At the level of a single viz, Tableau evaluates active fields in pairs to determine how they relate to each other(Link opens in a new window).
An unrelated icon ![]() on a field means it's unrelated to at least one other field in the viz. This icon can appear in a pill on a shelf or in the Data pane. (In some instances, there may be a related icon
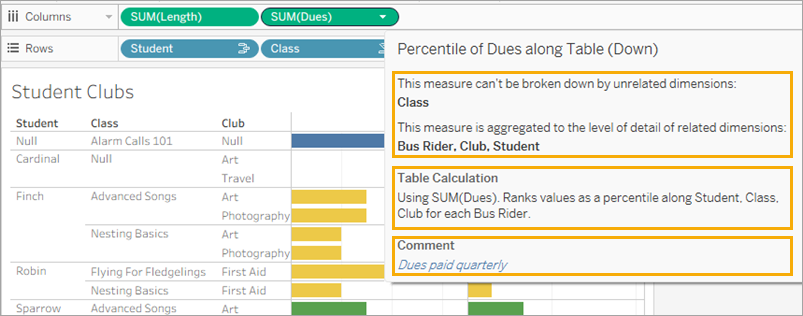
on a field means it's unrelated to at least one other field in the viz. This icon can appear in a pill on a shelf or in the Data pane. (In some instances, there may be a related icon ![]() .) Hovering over the icon opens a tooltip with more information. There are different messages for different types of field relatedness, including:
.) Hovering over the icon opens a tooltip with more information. There are different messages for different types of field relatedness, including:
- Unrelated dimension-dimension pairs
- Unrelated dimension-measure pairs
- Stitching dimensions
- Unrelated filter pairs
Tip: In Tableau, aggregated dimensions—such as ATTR(dimension) or MIN(dimension)—function as measures.
The messages also varies slightly depending on whether the field is in use on a shelf or in the Data pane.
- On a shelf: The tooltip for pills on shelves provides information about how the fields in the viz are related to each other and what impact that has on how Tableau computed the results.
- In the Data pane: The tooltip for fields in the data pane provides information about what would happen if that field were added to the viz. Fields in the Data pane can also be de-emphasized with light gray text if they don't related to any fields in the viz.
There are various features that might add to field's comment, such as table calcs and user-provided comments. All of these pieces of information are displayed in one unified tooltip.
Know your data model
Whenever you're working with a data model that contains multi-fact relationships, it's useful to refer to the model regularly. Use the View Data Model(Link opens in a new window) option (Worksheet menu > View Data Model) to open a dialog with the data model you can refer to while on a sheet tab.
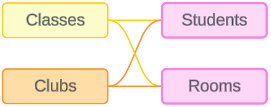
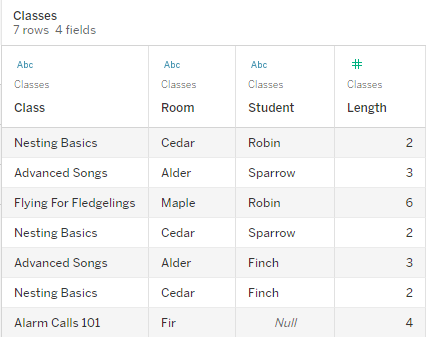
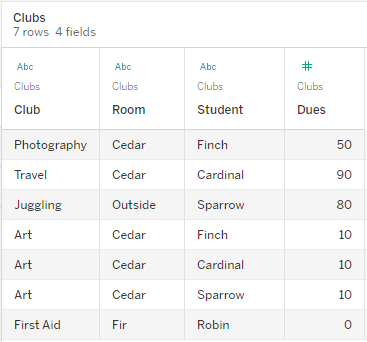
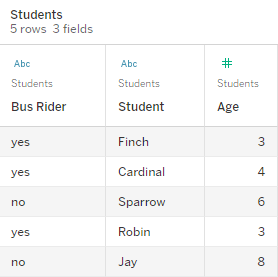
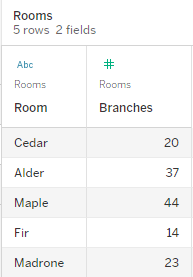
The examples in this topic are based on a data model with two base tables, Classes and Clubs, and two shared tables, Students and Rooms.
|
Classes |
Clubs |
Students |
Rooms |
|
|
|
|
|
Fields:
|
Fields:
|
Fields:
|
Fields:
|
Unrelated dimension-dimension pair
Unrelated dimensions are cross joined, which can result in combinations of dimension members across the headers that do not reflect actual combinations of data in the underlying tables.
The message for an unrelated dimension-dimension pair is:
- On a shelf: Unrelated dimensions show all possible combinations of values. Unrelated to: <list of dimensions>
- In the Data pane: If used, this dimension will show all possible combinations of values with unrelated dimensions: <list of dimensions>
- Grayed out in the Data pane: This dimension isn't related to any dimensions in the viz. If used, it will show all possible combinations of values with other unrelated dimensions.
And for an unrelated filter, the message is:
- In the viz: This field isn't filtered by unrelated filters: <filters>
- In the Data pane: If used, this field will be ignored by unrelated filters: <filters>
Cross joins can be expensive operations that negatively impact performance. Because of this, Tableau also displays a Relatedness warning dialog if you add an unrelated dimension to the viz.
Stitching dimensions
Although there are analytically relevant reasons to visualize unrelated dimensions alone, a common "happy path" for analysis with multiple base tables is to use a stitching dimension in addition. In the presence of a stitching dimension, the unrelated dimensions are no longer cross joined but are outer joined instead. Outer joins may still introduce nulls, but the dimension member headers are trimmed down from every possible combination to combinations that are relevant to at least one side of the outer join. They also don't have the same potential for performance impacts as cross joins. If there are no other relatedness issues that would call for an unrelated icon, a stitching dimension shows a related icon ![]() instead.
instead.
The message for a stitching dimension is:
- On a shelf: This dimension stitches together the following fields: <list of fields>
- In the Data pane: If used, this dimension will stitch together the following fields: <list of fields>
- Grayed out in the Data pane: doesn't apply, stitching only occurs in a viz
|
Unrelated: Cross join |
Stitched: Outer join of intermediate inner joins |

A viz showing a cross join of Class and Club with rows for every combination of Advanced Songs/Alarm Calls 101/Flying for Fledglings/Nesting Basics with Art/First Aid/Juggling/Photography. |

A viz showing the results of an outer join of the Student-Class inner join and the Student-Club inner join. Not all combinations of classes and clubs are represented, and there are rows for students and clubs without a class. |
Unrelated dimension-measure pair
For information about how measure values are computed and why relatedness of the dimensions matters, see An aside on how measure values are computed.
The message for the measure is:
- On a shelf: This measure can't be broken down by unrelated dimensions: <list of dimensions>.
- In the Data pane: If used, this measure won't be broken down by unrelated dimensions: <list of dimensions>
- Grayed out in the Data pane: This measure isn't related to any dimensions in the viz. If used, it won't be broken down.
The message for the dimension is:
- On a shelf: This dimension can't break down unrelated measures: <list of measures>
- In the Data pane: If used, this dimension won't break down unrelated measures: <list of measures>
- Grayed out in the Data pane: This dimension isn't related to any measures in the viz. If used, it won't break down measure values.
And for an unrelated filter, the message is:
- In the viz: This field isn't filtered by unrelated filters: <filters>
- In the Data pane: If used, this field will be ignored by unrelated filters: <filters>
The result in a viz is a repeated value for the measure across the unrelated dimension's values. This behavior is similar to when an LOD expression is used to set the level of aggregation for a measure at a different level of detail from the native granularity of the viz. An unrelated dimension is essentially EXCLUDED from the computation of the measure's aggregated value.

Not yet related
Fields with potential relationships are called not yet related and are evaluated as unrelated in the viz. Resolving not yet related fields is done differently than resolving truly unrelated fields (which can only be stitched), so the tooltip calls out why they're considered unrelated.
The message for the dimension depends on if it's not yet related to another dimension, measure, or filter.
- For a dimension-dimension pair, the message for the dimension is:
- On a shelf: Unrelated dimensions show all possible combinations of values. This dimension is not yet related to and so is treated as unrelated to the following: <list of dimensions>
- In the Data pane: If used, this dimension won't yet be related to and so is treated as unrelated to the following: <list of dimensions>
- For a dimension-measure pair, the message for the dimension is:
- On a shelf: This dimension is not yet related to and so can't break down the following: <list of measures>
- In the Data pane: If used, this dimension will not yet be related to and so won't break down the following: <list of measures>
- For a dimension-filter pair, the message for the dimension is:
- On a shelf: This field is not yet related to and so is ignored by these filters: <list of filters>
- In the Data pane: If used, this field won't yet be related to and so will be ignored by unrelated filters: <list of filters>
The message for the measure depends on if it's not yet related to a dimension or a filter.
- For a measure-dimension pair, the message for the measure is:
- On a shelf: This measure is not yet related to and so can't be broken down by the following: <list of dimensions>
- In the Data pane: If used, this measure won't yet be related to and so won't be broken down by the following: <list of dimensions>
- For a measure-filter pair, the message for the measure is:
- On a shelf: This field is not yet related to and so is ignored by these filters: <list of filters>
- In the Data pane: If used, this field won't yet be related to and so will be ignored by unrelated filters: <list of filters>
For information about how measure values are computed and why relatedness of the dimensions matters, see An aside on how measure values are computed.
Ambiguously related
Fields with more than one active possible relationship are called ambiguously related and are evaluated as unrelated in the viz. Resolving ambiguously related fields is done differently than resolving truly unrelated fields (which can only be stitched), so the tooltip calls out why they're considered unrelated.
The message for the dimension is:
- On a shelf: This dimension is ambiguously related to and so can't break down the following: <list of measures>
- In the Data pane: If used, this dimension will be ambiguously related to and so won't break down the following: <list of measures>
The message for the measure depends on if the ambiguity is with a dimension or a filter.
- For a measure-dimension pair, the message for the measure is:
- On a shelf: This measure is ambiguously related to and so can't be broken down by the following: <list of dimensions>
- In the Data pane: If used, this measure will be ambiguously related to and so won't be broken down by the following: <list of dimensions>
- For a measure-filter pair, the message for the measure is:
- On a shelf: This measure is ambiguously related to and so is ignored by these filters: <list of filters>
- In the Data pane:If used, this measure will be ambiguously related to and therefore ignored by the following filters: <list of filters>
For information about how measure values are computed and why relatedness of the dimensions matters, see An aside on how measure values are computed.
Measure from a shared table
When a dimension from a shared table (like Students) is used, it stitches together the dimensions from otherwise unrelated tables (such as Classes and Clubs). But what if instead of a dimension, you use a measure from the Students table instead? Measures can't stitch.

In a case where there are unrelated dimensions visualized together, the measure can't be broken down by those dimensions simultaneously. (For information about how measure values are computed and why relatedness of the dimensions matters, see An aside on how measure values are computed.) In this case, we treat the measure as unrelated to the combination of dimensions even though it would be related to any dimension individually.
To resolve this type of ambiguity and prevent the measure from being table scoped, the unrelated dimensions could be stitched or one or more dimensions could be removed until there is a clear relationship path for aggregating the measure.
All dimensions are unrelated to each other
The message for a measure shared across unrelated dimensions is:
- On a shelf: This measure can only be broken down by one of these dimensions at a time: <bulleted list of dimensions>
- In the Data pane: If used, this measure can only be broken down by one of these dimensions at a time: <bulleted list of dimensions>
The message for each of the dimensions is:
- On a shelf: This dimension can't break down the measure <measure> in combination with the following dimensions: <bulleted list of dimensions>
- In the Data pane: If used, this dimension can't break down the measure <measure> in combination with the following dimensions: <bulleted list of dimensions>
Some dimensions are related to each other
If some of the dimensions are related to each other, the related dimensions could break down the measure without the presence of the unrelated dimension. It's useful to know if any of the dimensions are related amongst themselves. (For example: If a viz is made with related dimensions Dim1 and Dim2 and a dimension DimA that's unrelated to both of them, a measure from the shared table isn't unrelated to all three dimensions equally. Dim1 and Dim2 don't conflict with each other, but both of them conflict with DimA. To resolve by removing fields, you could either remove DimA alone or both Dim1 and Dim2.)
In this situation, the dimensions are listed in groups in the tooltip message.
The message for the measure shared across groups of unrelated dimensions is:
- On a shelf: This measure can only be broken down by one of the following groups of dimensions at a time:<bulleted list of dimensions>
- In the Data pane: If used, this measure can only be broken down by one of the following groups of dimensions at a time: <bulleted list of dimensions>
The message for each of the dimensions is:
- On a shelf: This dimension can't break down the measure <measure> in combination with the following groups of dimensions: <bulleted list of dimensions>
- In the Data pane: If used, this dimension can't break down the measure <measure> in combination with the following groups of dimensions: <bulleted list of dimensions>
Related measure
When a measure is related to some dimensions in the viz but not others, the measure may have an additional message in the tooltip that explains what dimensions it is related to. This can help explain how the measure is aggregated. This message only appears when the measure is also unrelated to a dimension in the viz. Otherwise, it's standard behavior that the measure is aggregated to the level of detail of its related measures.
The message for the measure is:
- On a shelf: This measure is aggregated to the level of detail of related dimensions: <dimensions in the viz this measure is related to>
- In the Data pane: If used, this measure will be aggregated to the level of detail of related dimensions: <dimensions in the viz this measure is related to>
This message is intended to help identify which dimension or dimensions are considered when the measure value is computed. For information about how measure values are computed and why relatedness of the dimensions matters, see An aside on how measure values are computed.
Filters
Relatedness is also evaluated for fields on the filter shelf compared to fields otherwise active in the viz.
An icon and tooltip appears when a filter is unrelated to at least one field in the viz. Both the filter field and field in the viz have a tooltip.
The message for a filter is:
- Unrelated filter: This filter doesn't apply to unrelated fields: <fields>
- Ambiguous filter: This filter ignores the following measures because it is ambiguously related to them: <list of measures>
- Not yet related filter: This filter ignores the following fields because it is not yet related to them: <list of fields>
The behavior of filters also depends on their relatedness to other fields in the viz. A filter doesn't impact the values of fields it isn't related to. Unless the filter is set to no values (excluding everything or including nothing), the viz will remain unchanged for any fields that aren't related to the filter. However, deselecting every option in the filter will return a blank viz.

Two screenshots of viz with an unrelated filter, showing that deselecting options in the interactive filter control doesn't impact the viz
Related fields are filtered as expected. In a more complex viz with a combination of related and unrelated fields (such as in a stitching context), the filter will only impact values that are related to the filter field.
An aside on how measure values are computed
When a measure isn't related to a dimension, it can't be broken down by that dimension's members (that is, you can't break down the average class length per club when clubs don't have a class length). Instead, the measure will be aggregated at a different level than the dimension member's headers in the view.
In Tableau, measures are aggregations—they’re aggregated up to the granularity set by the dimensions in the view. The value of a measure therefore depends on the context of the dimensions. For example, "number of cereal boxes" depends on if we mean the total inventory or the number of boxes per brand.
Dimensions are usually categorical fields, such as country or brand. In Tableau, dimensions set the granularity, or the level of detail, of the view. We typically want to group our data into marks by some combination of categories. What dimensions we use to build the view determines how many marks we have.
Aggregation refers to how the data is combined. Tableau's default aggregation is SUM. You can change the aggregation to other options, including: average, median, count distinct, minimum, and so on. Granularity refers to how detailed or broken down the measure is—which is controlled by the related dimensions. Unless the granularity of the measure is row level (aka disaggregated), its value must be aggregated.
Example

What's the value of "number of boxes of cereal"?
Well, it depends on the aggregation type and the granularity as set by the dimensions.
- Aggregations:
- Sum (or total)
- Average
- Granularity:
- Table scoped / fully aggregated (the blue bars in the example)
- Broken down by the Brand dimension (the colored bars in the example)

The value of a measure trails the dimension members
A measure's value is determined by the dimensions it is related to. A measure without a related dimension is table scoped. A measure with a related dimension is broken down by the related dimension's members (that is, the value of the measure is computed for each dimension member). If a related dimension's members are repeated due to the presence of an unrelated dimension, the measure's values are repeated based on its dimension members.
- A measure without a dimension is table scoped to its overall value.

- A measure, in the presence of an unrelated dimension alone, is table scoped and repeated for the unrelated dimension's members.

- A measure in the presence of related dimension is broken down more granularly and its value is computed per member of the related dimension.

- A measure, in the presence of an unrelated dimension and a related dimension, is broken down by the dimension it's related to. Wherever those related dimension members are repeated for unrelated dimensions, the measure value trails along with its related dimension member.

Because dues are per club, the value of dues for each club is repeated every time that club is repeated.
