Calculate Percentages in Tableau
Any analysis in Tableau can be expressed in terms of percentages. For example, rather than viewing sales for every product, you might want to view each product’s sales as a percentage of the total sales for all products.
About percentages
There are two factors that contribute to the percentage calculation:
1. The data to which you compare all percentage calculations
Percentages are a ratio of numbers. The numerator is the value of a given mark. The denominator depends on the type of percentage you want, and is the number to which you compare all your calculations. The comparison can be based on the entire table, a row, a pane, and so on. By default, Tableau uses the entire table. Other percentage calculations are available via the Percentage of menu item. See Percentage options.
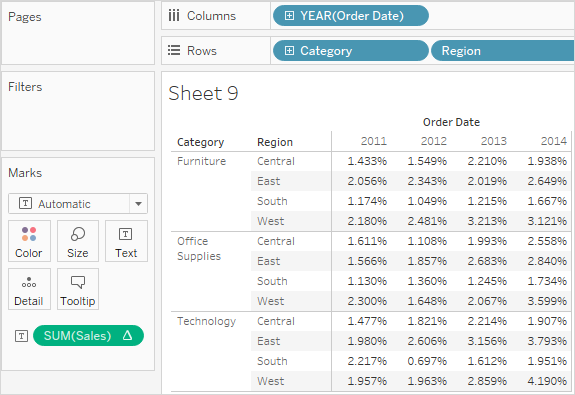
The figure below is an example of a text table with percentages. The percentages are calculated with the Sales measure aggregated as a summation, and are based on the entire table.
2. The aggregation
Percentages are computed on the basis of the aggregation for each measure. Standard aggregations include summation, average, and several others. See Data Aggregation in Tableau for more information.
For example, if the aggregation applied to the Sales measure is a summation, then the default percentage calculation (percent of table) means that each number displayed is the SUM(Sales) for that mark divided by the SUM(Sales) for the entire table.
In addition to using predefined aggregations, you can use custom aggregations when calculating percentages. You define your own aggregations by creating a calculated field. Once the new field is created, you can use percentages on the field as you would any other field. See Aggregate Functions in Tableau(Link opens in a new window) for more information.
Percent calculations can also be applied to disaggregated data. In this case, all values are expressed as the percentage of a summation. You cannot choose any other aggregation.
Example
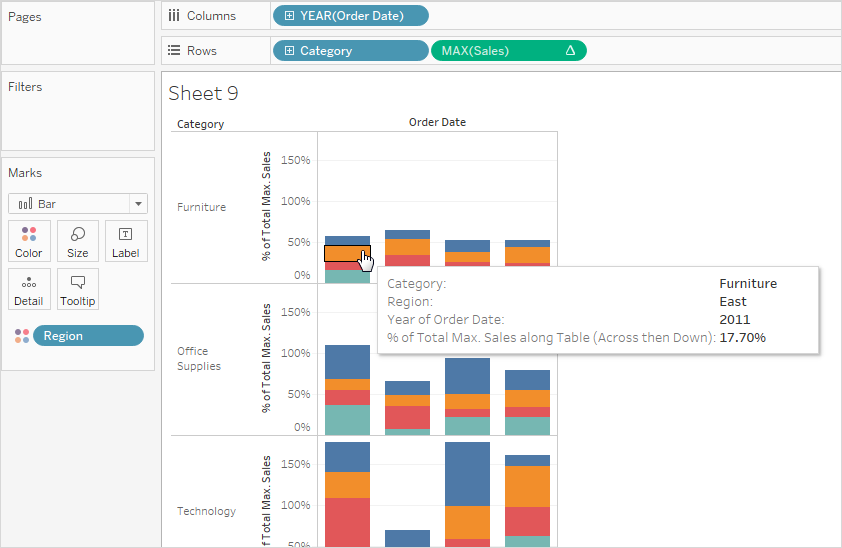
The view below shows a nested bar chart created using two dimensions and a measure that is aggregated as a maximum. Additionally, the data are color-encoded by a dimension and the default percentage calculation has been applied. Notice that the axis labels are modified to reflect the percent calculation.
The tooltip reveals that the maximum sales for furniture in the east in 2011 is 17.70% of the maximum for the entire table. What is the maximum for the table? If you recreate the view you'll see that the maximum occurs in the South, in the Technology category, in the year 2011. The tooltip for this bar segment would reveal a maximum sales of 100%.
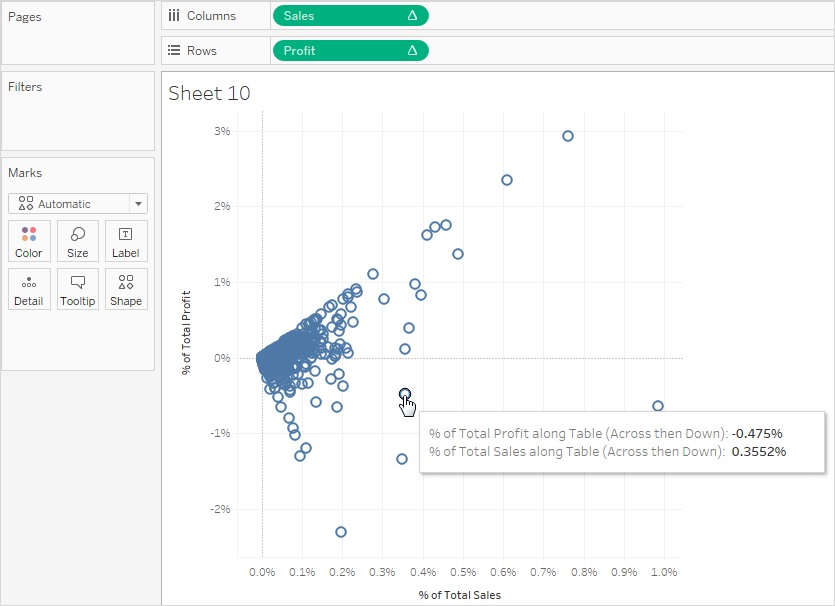
The next view displays two disaggregated measures as a scatter plot. Again, the default percentage calculation has been applied as reflected by the modified axis labels.
The tooltip shows that the selected data point constitutes -0.475 percent of total profit and a 0.3552 percent of total sales. Percentage calculations are based on the entire data source.
How to calculate percentages
To calculate percentages in your visualization:
- Select Analysis > Percentages Of, and then select a percentage option.
Percentage options
Computing a percentage involves specifying a total on which the percentage is based. The default percentage calculation is based on the entire table. You can also choose a different option.
The option you choose is applied uniformly to all measures that appear on a worksheet. You cannot choose Percent of Column for one measure and Percent of Row for another.
The percentage options on the Analysis menu correspond to the percentage table calculations. When you select a percentage option, you are actually adding a Percent of Total table calculation. See Transform Values with Table Calculations for more information.
If you are unsure what the current percentage calculation means, display the grand totals. This provides more information about each row and column. For example, if you select Percent of Row while displaying grand totals, you will see that the total for each row is exactly 100%. See Show Totals in a Visualization for more information on grand totals.
The percent calculation options are described in the following sections. In each case, the grand totals are displayed as well.
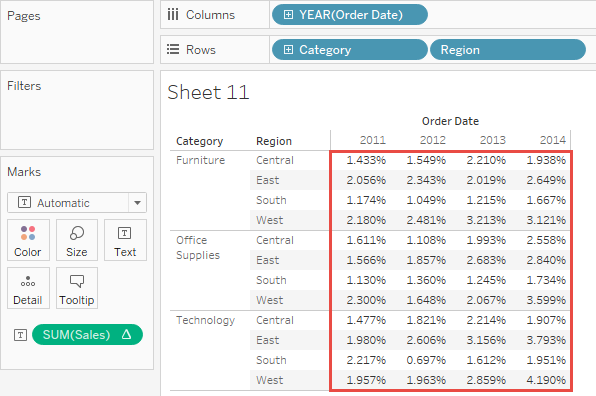
Percent of Table
When you select Percentage Of > Table from the Analysis menu, each measure on the worksheet is expressed as a percentage of the total for the entire worksheet (table). For example, Technology in the East region accounts for 3.79% of total sales in 2014. The grand totals for rows show that 2014 accounts for 31.95% of the total sales. Summing the grand totals for rows or for columns yields 100% of the total.
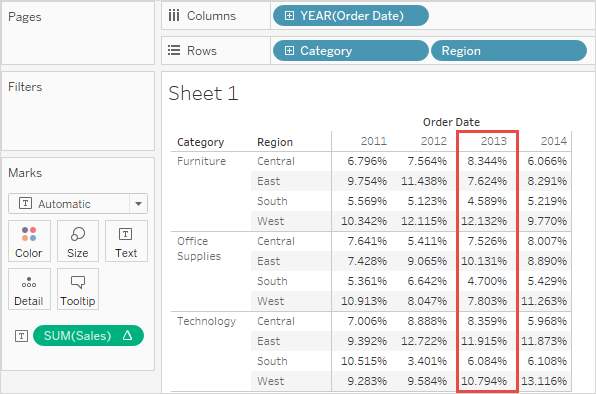
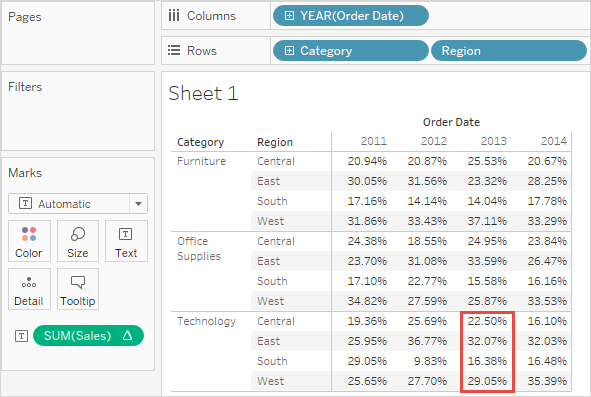
Percent of Column
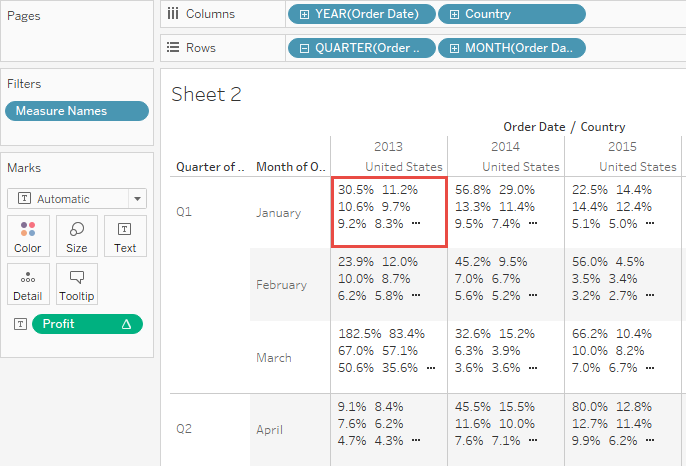
When you select Percentage of > Column from the Analysis menu, each measure on the worksheet is expressed as a percentage of the total for the column. The values within the red box add up to 100%.
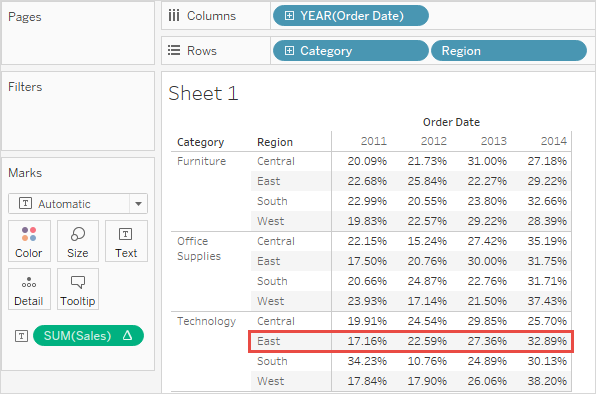
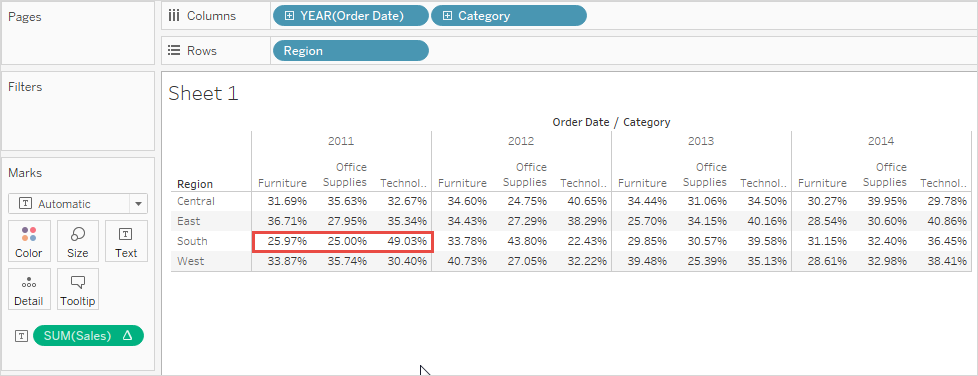
Percent of Row
When you select Percentage of Row, each measure on the worksheet is expressed as a percentage of the total for the row. The values within the red box add up to 100%.
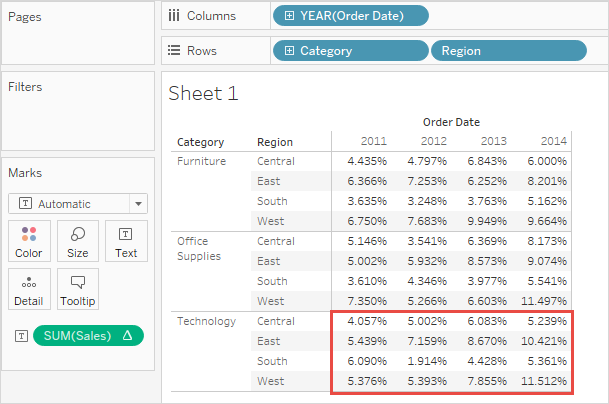
Percent of Pane
When you select Percentage of > Pane from the Analysis menu, each measure on the worksheet is expressed as a percentage of the total for the panes in the view. This option is equivalent to Percent of Table when the table consists of only a single pane.
In the following view, the red box constitutes a single pane; the values within the red box add up to 100%.
Percent of Row in Pane
When you select Percentage of > Row in Pane from the Analysis menu, each measure on the worksheet is expressed as a percentage of the total for a row within a pane. This option is equivalent to as Percent of Row when the table is only a single pane wide.
In the following view, the red box constitutes a row within a pane; the values within the red box add up to 100%.
Note: If you place Measure Names as the inner dimension on the Columns shelf (that is, the dimension farthest to the right), Tableau will return 100% for each mark because you cannot total up the values for multiple measure names. For example, you can’t total up the values for SUM(Sales) and SUM(Profit).
Percent of Column in Pane
When you select Percentage of > Column in Pane from the Analysis menu, each measure in the worksheet is expressed as a percentage of the total for a column within a pane. This option is equivalent to as Percent of Column when the table is only a single pane high.
In the following view, the red box constitutes a column within a pane; the values within the red box add up to 100%.
If you place Measure Names as the inner dimension on the Rows shelf (that is, the dimension farthest to the right on the shelf), Tableau will return 100% for each mark because you cannot total up the values for multiple measure names. For example, you can’t total up the values for SUM(Sales) and SUM(Profit).
Percent of Cell
When you select Percentage Of > Cell from the Analysis menu, each measure on the worksheet is expressed as a percentage of the total for each individual cell in the view. Most views show only one value per cell, in which case all cells show a percentage of 100%. But in some cases, as, for example, when you disaggregate data, a single cell can contain multiple values: