Add a Calculated Column to a View
Sometimes your data may not have all the pieces you need for your analysis. A common way to handle this is to create a calculated column (also referred to as a calculated field or just a calculation) that modifies the existing data. Calculations can be created by opening the Analysis menu and selecting Create Calculated Field...
It's important to note that there are often several different ways to achieve the same results for a calculated field. Additionally, the correct value of a calculation may depend on how the data is shaped and how the visualization is set up. Make sure you understand your data structure and how the viz will be built when determining how to write a calculation.
Examples of when a calculation might be useful
Combine first and last name
You may have First name and Last name in two different columns and want a single field for name.

The calculation:
[First name] + " " + [Last name]
A finished viz might look like this

Find a sequence inside a string
You may want to flag every record that has a certain manufacturing code XYZ in the Product ID field.

The calculation will return "true" if the code is present and "false" if not.
CONTAINS([Product ID}, "XYZ")
A finished viz might look like this, with the calculation on Color.

Assign categories for value ranges
You want to assign categories based on several thresholds.

The calculation will evaluate each student's GPA against the cutoff value and assign a label.
IF [GPA] <3 THEN "Needs Improvement" ELSEIF [GPA] <3.5 THEN "Sufficient" ELSE "Excellent" END
A finished viz might look like this, with the calculation on Color.

Calculate percent change
You want to display the year-over-year (YOY) percentage change in the weight of children from age 1 to age 2.

This calculation is for the difference/original for each child.
(SUM((IF [Age] = 2 THEN [Weight] ELSE 0 END)) - SUM((IF [Age] = 1 THEN [Weight] ELSE 0 END)))/SUM(IF [Age] = 1 THEN [Weight] ELSE 0 END)
A finished viz might look like this.

This example is one where the calculation could change quite a lot based on the structure of the data. If there was a field for weight at age 1 and weight at age 2, for example, the calculation would only need to be ([Weight at age 2] - [Weight at age 1]) / [Weight at age 1]. However, the data structure detailed above is more standard and more likely to be encountered.
Follow along: create a YOY calculation
Objective
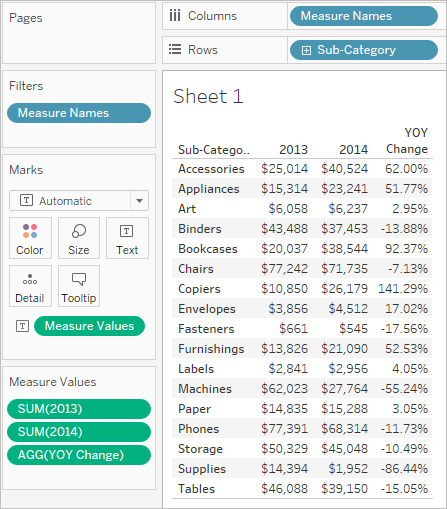
To create a view like the following, that shows sales results for two years in the first two columns, and then the year-over-year change, as a percentage, in the third column. The scenario uses the Sample - Superstore data source provided with Tableau Desktop to show how to build the viz.
Create the necessary calculated fields
-
Connect to the Sample - Superstore data source.
-
Choose Analysis > Create Calculated Field to open the calculation editor. Name the calculation 2013 and type or paste the following in the formula area:
IF YEAR([Order Date]) = 2013 THEN [Sales] ELSE 0 END -
Create a second calculated field and name it 2014; the formula is the same except with 2014 instead of 2013:
IF YEAR([Order Date]) = 2014 THEN [Sales] ELSE 0 END -
Create a third calculated field, YOY Pct. Change, to calculate the change from 2013 to 2014:
(SUM([2014]) - SUM([2013])) / SUM([2013])
Format the calculated fields
-
Click 2013 in the Measures area of the Data pane and choose Default Properties > Number Format.
-
In the Default Number Format dialog box, set the format to Currency (Custom) and the Decimal places to 0.

-
Format the 2014 measure the exact same way.
-
Format the YOY Pct. Change field as Percentage, with 2 decimal places.
Build the view
-
Drag 2013 to Text on the Marks card.
-
Double-click 2014 and then YOY Pct. Change.
-
Drag Measure Names from Rows to Columns.
-
Drag Sub-Category to Rows.
Your view should now look like the one at the beginning of this section.