Tableau Desktop and Web Authoring Release Notes
This topic describes what’s new in the latest release. Use the viz below to explore new features in Tableau Desktop and web authoring. Click a feature name to display a tooltip with a link to documentation for that feature. Apply filters to refine your search.
- Click Search by Feature to see a list of new features for a product or version, or to explore when a feature was released.
- Click Upgrade Desktop to see a list of all features specific to Tableau Desktop and web authoring.
Tip: Click the Download button in the viz toolbar (while no feature names are selected), and then select Data to export the list to a CSV file that you can customise.
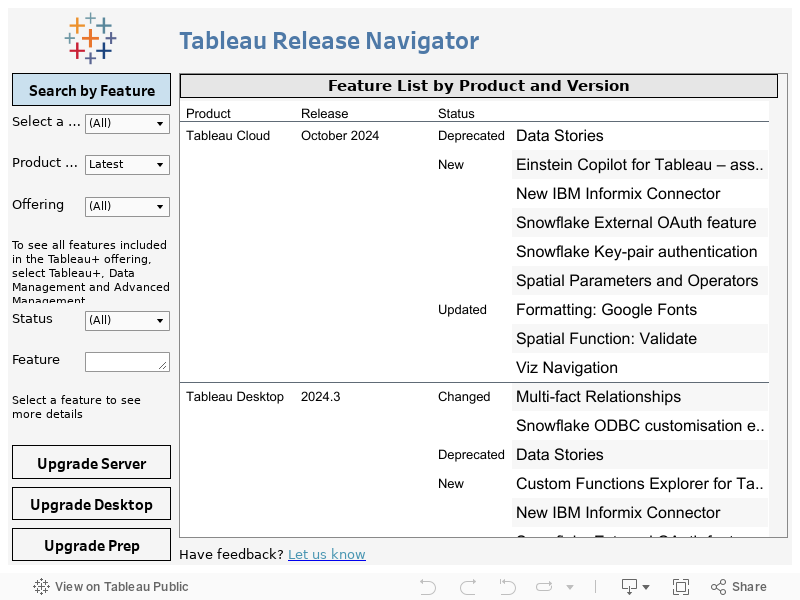
Click on the Tableau logo in the bottom-left corner of the viz toolbar to view this workbook on Tableau Public