Hospital Bed Use with Tableau Prep
Reaching capacity in a hospital is problematic but so is an overabundance of resources. It's important to understand hospital beds from the perspective of the bed as a resource. However, the data is often stored from the perspective of a patient. How can we take data that captures when patients are in beds and determine the bed usage?
Note: To complete the tasks in these tutorials, you need Tableau Prep and optionally Tableau Desktop installed:
To install Tableau Prep and Tableau Desktop see the Tableau Desktop and Tableau Prep Deployment guide(Link opens in a new window). Otherwise you can download the Tableau Prep(Link opens in a new window) free trial and Tableau Desktop Free Edition.
You will also need to download three data files. It is recommended to save them in your My Tableau Prep Repository > Datasources folder.
- Beds.xlsx(Link opens in a new window)
- Hours.xlsx(Link opens in a new window)
- Patient Beds.xlsx(Link opens in a new window)
The Data
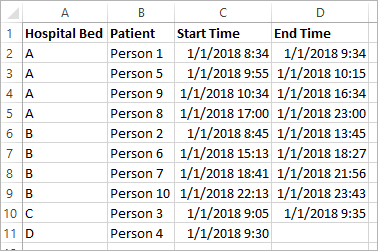
For our four beds, A, B, C, and D, we track which patient was in the bed and their start and end time there. The data looks like this:
Preliminary Analysis
If we bring this data into Tableau Desktop, we can create a Gantt chart to show when patients are in beds.
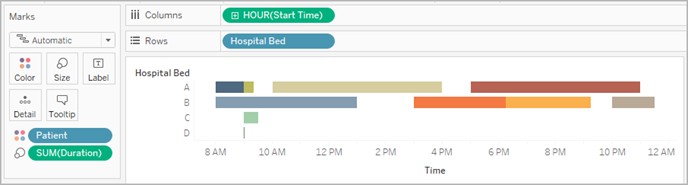
This is a useful visual. We can see that there are only small gaps in use for beds A and B, but bed C is very under-used. Bed D's patient has no end time, but we could address that with some calculations. This gives us a visual overview of how the beds are used.
However, what if we wanted to count the hours when a bed was empty? Or compare open bed time before and after a new policy is put in place? There's no easy way to do that with the data as it's currently structured.
Desired Data Structure
By creating some very basic data sets and combining them in Tableau Prep, we can modify this data set into a form that will allow us to perform deeper analysis and create even more useful visualizations.
Before we jump into Tableau Prep, let's step back and think about what we need to create to answer the question, "How many hours was each bed empty?"
We need to be able to look at each bed for each hour, and know whether or not there was a patient in the bed. Right now, the data is solely when a patient was in the bed; we haven't given Tableau information about the empty hours.
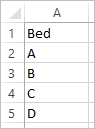
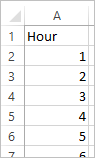
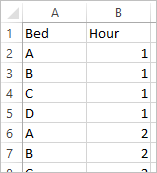
To create that full matrix of all beds and all hours, we'll create two new data sets. One is simply a list of beds (A, B, C, D) and the other is a list of hours (1, 2, 3, …, 23, 24). By performing a cross join (joining every row in one data set with every row in the other data set) we'll wind up with every possible combination of beds and hours.
| The Beds.xlsx data set looks like this: | The Hours.xlsx data set looks like this: | And the cross joined results look like this: |
|
|
|
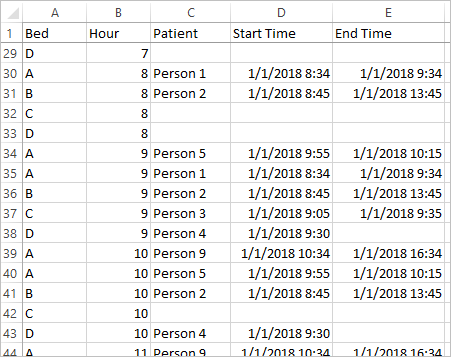
Next, we'll bring in the Patient Beds information, labeling each bed-hour combination as having a specific patient or not. We wind up with a data set that has a row for each bed-hour, and if a patient was in the bed, their number and start and end times. Null values indicate the bed was unoccupied.
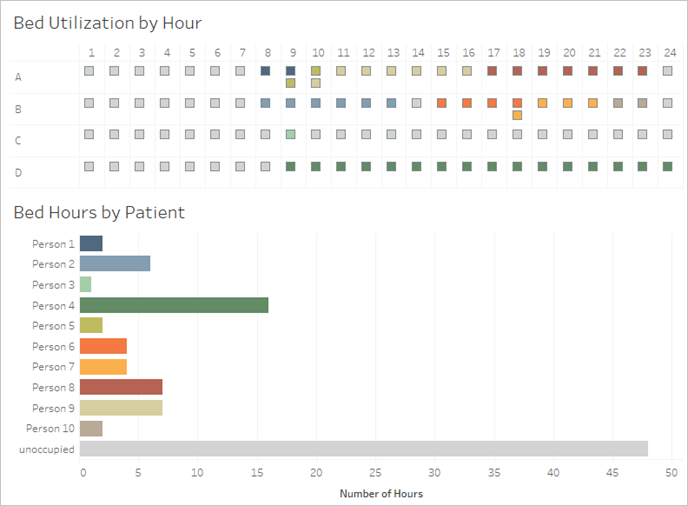
With the data in this structure, we can perform analyses like this, which enables us to investigate unoccupied beds as easily as patient beds.
Restructuring the Data
So how do we get there with Tableau Prep? We'll build out the flow in two parts, first building the Bed Hours matrix, then combining it with the Patient Beds data. Make sure you've downloaded all three Excel files (Beds.xlsx, Hours.xlsx, and Patient Beds.xlsx) to follow along.
Bed Hour Matrix
First, we'll connect to the Beds.xlsx file.
- Open Tableau Prep.
- From the start screen, select Connect to Data.
- On the Connections pane, select Microsoft Excel. Navigate to where you saved Beds.xlsx and select Open.
- The Beds sheet should automatically be brought out to the Flow pane.
Tip: For more information about connecting to data, see Connect to Data(Link opens in a new window).
Next, we need to create a field we can use to do the cross join with the Hours data set. We'll add a calculation that is simply the value 1.
- In the Flow pane, select Beds and select the suggested Clean Step.
- With the Clean step we just added, the Profile pane will come up. Select Create Calculated Field in the toolbar.
- Name the field Cross Join and enter the value 1.
- The Data grid should update show the current state of the data.

Now we'll repeat the process with the Hours data set.
- On the Connections pane, select the Add connection
 button to add another data connection.
 - Choose Microsoft Excel and then select the Hours.xlsx file and click Open.
- In the Flow pane, select Hours and select the suggested Clean Step to add it to the flow.
- From the toolbar in the Profile pane, create a calculated field named Cross Join and enter the value 1.

Both data sets now have a shared field, Cross Join, and can be joined.
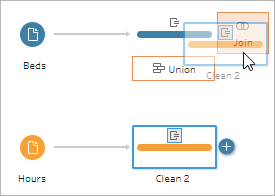
- Join the two cleaning steps by dragging Clean 2 onto Clean 1 and dropping it on the Join option.
- In the Join Profile below, the join configurations should populate automatically.
- Because we named both fields Cross Join, Tableau Prep automatically identifies them as the shared field and creates the appropriate Applied Join Clauses.
- The default Join Type is inner, which is what we want.
- This join will match all rows from Beds with all rows from Hours, as seen in the Data grid.
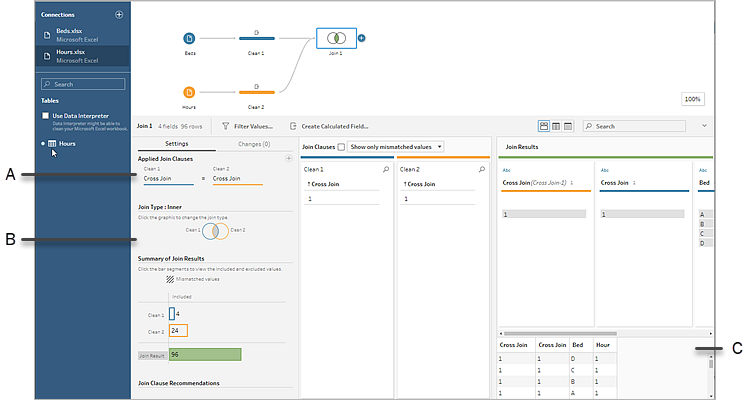
A. Join clause
B. Join type
C. Data grid results
Tip: For more information about joins, see Join your data(Link opens in a new window).
We no longer need the Cross Join fields, so we can remove them.
- In the Flow pane, select Join 1, select the plus
 icon, and add a Clean Step.
 - Select the fields Cross Join-1 and Cross Join, and select Remove Fields.
- Double click on the Clean 3 label and rename that step Bed Hour Matrix.
We now have the Bed Hour Matrix data set that contains all beds and all hours and have finished the first part of building our data set.
Patient Bed Use
Part two is bringing in the patient bed usage. To start, we'll connect to the data.
- On the Connections pane, select the Add connection button to add another data connection.
- Choose Microsoft Excel and then select the Patient Beds.xlsx file, and select Open.
- In the Flow pane, select Patient Beds, then select the suggested Clean Step to add it to the flow.
Because the Bed Hour Matrix file is based on hour but Patient Beds is based on actual time, we need to pull the hour out of the Patient Beds start and end times. Additionally, for the end time, we want to ensure that if a patent is still in the bed at the end of the day (midnight, hour 24) we indicate that the bed is occupied even though there's no end time in the data set. We'll add a calculated field in this new step.
- In the toolbar, click Create Calculated Field.
- Name the field Start Hour. For the calculation, enter
DATEPART('hour',[Start Time]). - This takes the hour of the start time and pulls it out. Therefore, "1/1/18 9:35 AM" becomes simply "9".
- Create another calculated field named End Hour. For the calculation, enter
IFNULL(DATEPART('hour',[End Time]), 24).
The DATEPART portion takes the hour of the end time. The IFNULL portion will assign an end time of 24 (midnight) to any missing end time.
Now we're ready to join patient bed usage to the Bed Hour Matrix. This is a bit more complex join than we did previously. An inner join would only return values present in both data sets. Because we want to make sure we keep all the bed-hour slots, regardless of whether or not a patient was in the bed, we'll need to do a left join. This will result in a lot of nulls, but that's appropriate.
We also need to match when a bed-hour slot is taken by a patient (or patients). So in addition to matching the bed the patient is in we also need to consider the time. The Bed Hour Matrix data set just has an Hour field, and the Patient Beds data set has Start Hour and End Hour. We'll use some basic logic to determine if a patient should be assigned to a given bed-hour slot: A patient is considered in a bed if their start hour is less than or equal to (<=) the bed-hour slot AND their end hour is greater than or equal to (>=) the bed-hour slot.
Therefore, three join clauses are needed to appropriately match these two data sets together.
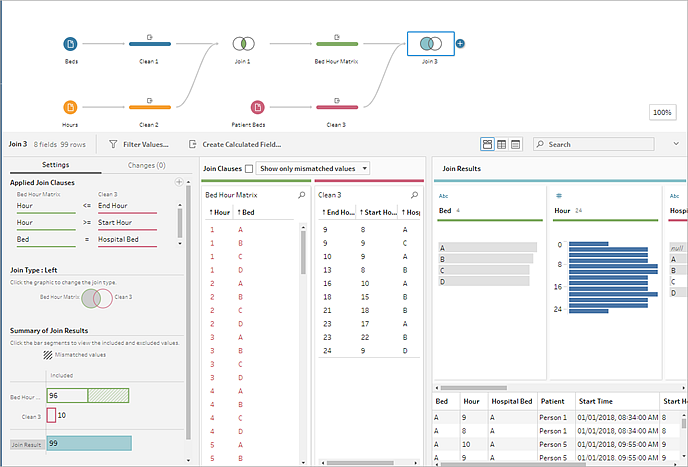
- Join the Clean 3 step with the Bed Hour Matrix step.
- In the Applied Join Clauses area, the default should be Hour = End Hour. Select the join clause to change the operator from "=" to "<=".

- Select the plus
 button in the upper right corner of the Applied Join Clauses area to add another join clause. Set it to Hour >= Start Hour. Add a third join clause for Bed = Hospital Bed.
- In the Join Type section, select the unshaded area of the graphic next to Bed Hour Matrix to change the join type to a Left join.
Note: If you drag the Bed Hour Matrix to Clean 3 instead of the other way around, the desired results can be obtained by using a right join instead of a left join. The order of dragging the steps matters for the orientation of the join. The join clauses will also be in reverse order—be sure to preserve the correct logic of comparing the hours.
Our data is now joined, but we should clean up some artifacts from the join and make sure the fields are tidy. We no longer need Start Hour and End Hour. Hospital Bed and Bed are also redundant. Finally, a value of null in the Patient field really means the bed is unoccupied.
- In the Flow pane, add a cleaning step so we can tidy up the joined data.
- Ctrl+click (Command+click on Mac) to multi select the fields End Hour, Start Hour, and Hospital Bed, then select Remove Fields in the toolbar.
- On the Patient field profile card, double click the null value and type Unoccupied.
We now have a data structure with a row for every bed-hour; if there was a patient in bed during that hour, we have the patient information as well. All that remains to do is add an output step and generate the data set itself.
- In the Flow pane, select Clean 4, select the plus icon, and add an Output step.
- In the Output pane, change the Output type to .csv then select Browse.
- Enter Bed Hour Patient Matrix for the name and choose the desired location before selecting Accept to save.
- Select theRun Flow button at the bottom of the pane to generate your output. Select Done in the status dialog to close the dialog.
Tip: For more information about outputs and running a flow, see Save and Share Your Work(Link opens in a new window).
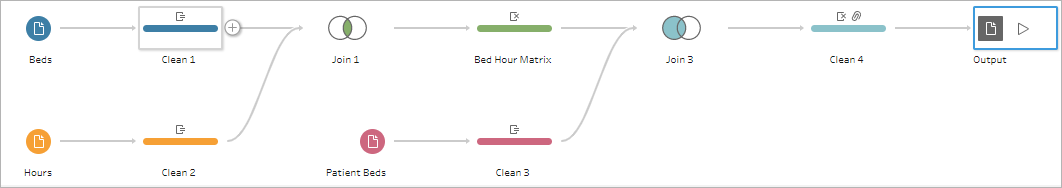
The final flow should look like this:
Analysis in Tableau Desktop
To install Tableau Desktop before continuing with this tutorial, you can download Tableau Desktop Free Edition.
Now that we have the data set in the desired structure, we can perform deeper analysis than with the original data.
- Open Tableau Desktop. In the Connect pane, select Text file, navigate to the Bed Hour Patient Matrix.csv file, and select Open.
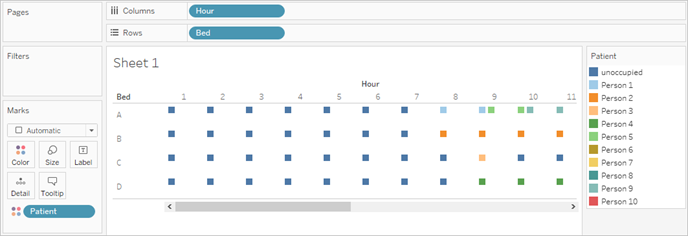
- On the Data source tab, the data should appear in the canvas by default. Navigate to Sheet 1.
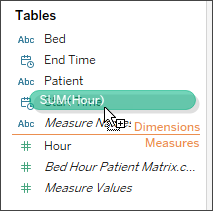
- In the Data pane, drag Hour above the line separating Measures and Dimensions to make it a discrete dimension.
- Drag Bed to the Rows shelf and Hour to the Columns shelf.
- Drag Patient to the Color shelf.
Formatting is optional, but may help make the visual more readable.
- Select the Color shelf and select Edit Colors.
- In the area to the left, select Unoccupied. From the drop down on the right, choose the Seattle Grays color palette.
- Select the fourth, lightest gray, and click OK.
- Select the Color shelf again, then click the Border drop-down. Choose the second gray option at the far right.
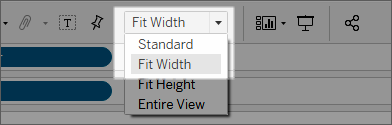
- In the toolbar, from the Size drop-down, change from Standard to Fit Width.
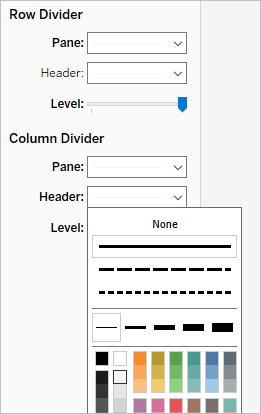
- Select the Format menu and then select Borders.
- For Row Divider, select the Pane drop-down and choose a very light gray.
- Adjust the Level slider to the second tick mark.
- Repeat with the Column Divider. Set the Pane color to be light gray and the Level to the second tick mark.
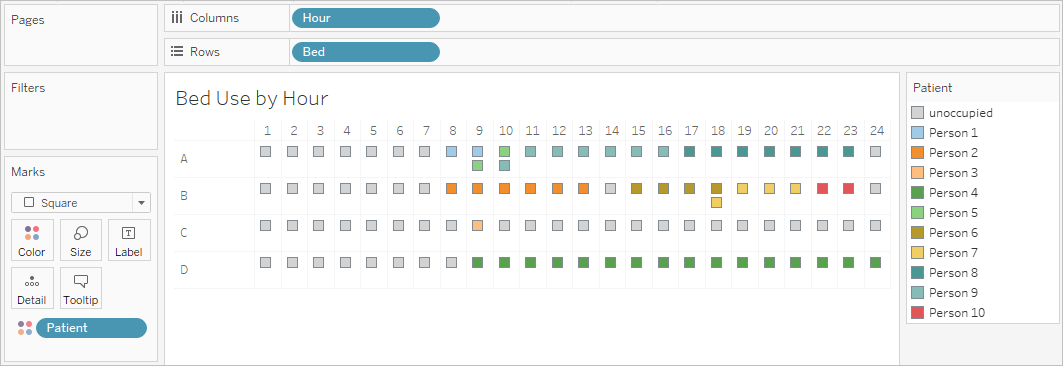
- Double click the sheet tab at the bottom and rename it Bed Use by Hour.
This view lets us quickly see when a given bed was occupied or open.
But we can go further and count the number of hours each bed was unoccupied.
- Select the new sheet tab
 icon at the bottom to open a clean sheet.
 - Drag Patient to Rows.
- Drag Hour to Columns. Right click the Hour pill to open the menu. Choose Measure > Count.
- Drag another copy of the Patient field from the Data pane to the Color shelf.
- Right click on the axis and select Edit Axis. Change the title to Hours and close the dialog.
- Rename the sheet tab Bed Hours by Patient.
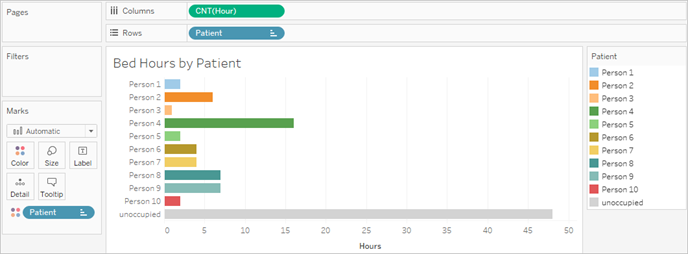
This view lets us identify how many unoccupied bed hours we had, something we couldn't do with the original data set. What other charts or dashboards can you create? Give it a try now that your data is in the right structure.
Recap and Resources
To build this data structure using Tableau Prep, we needed to perform the following actions:
- Build a data set for each aspect we want to analyze, in this case, Beds and Hours.
- Cross join those data sets to create a Bed Hour Matrix data set with every possible combination of beds and hours.
- Join the Bed Hour Matrix with the Patient Bed data, making sure the join keeps all bed-slot hours and the join clauses appropriately match patient bed data with the bed-hour slots.
We used the following calculations to create fields we could join on. The second and third pull out the hour information from the original datetime fields.
- Cross Join =
1- This simply assigns the value 1 to every row
- Start Hour =
DATEPART('hour',[Start Time])- This takes the hour of the start time and pulls it out. Therefore, "1/1/18 9:35 AM" becomes simply "9".
- End Hour =
IFNULL(DATEPART('hour',[End Time]), 24)- We could use
DATEPART('hour',[End Time]), as we did for Start Time. This takes the hour of the end time and pulls it out. Therefore, "1/1/18 4:34 PM" becomes simply "4". - But we want to indicate that the patient bed that is still occupied (no end time) is in use, not empty. To do so, we'll assign an end time of 24 (midnight) to any missing end time using the
IFNULLfunction. If the first argumentDATEPART('hour',[End Time])is null, the calculation will return "24" instead.
- We could use
Note: Want to check your work? Download the Tableau Prep packaged flow file (Hospital Beds.tflx(Link opens in a new window)) and the Tableau Desktop packaged workbook file (Hospital Beds.twbx(Link opens in a new window)).
Resources: Need more training? Take an in-person training(Link opens in a new window) course. Curious about the features we covered? Check out the other topics in the Tableau Prep online help. Looking for additional resources? The Master Tableau Prep with this list of learning resources(Link opens in a new window) blog post is for you.