Finding the Second Date with Tableau Prep
A common need in analytics is to determine the date a second event happens, such as when a customer made a second purchase—thereby becoming a repeat customer—or when a driver gets a second traffic violation. Finding the date of a first event is easy, it's simply the minimum date. Finding the second date is trickier.
In this two-part tutorial, we'll shape traffic infraction data and answer the following questions:
-
What was the length of time in days between the first and second infraction for each driver?
-
Compare the fine amounts for the first and second infractions. Are they correlated?
-
Which driver paid the most overall? Who paid the least?
-
How many drivers had multiple infraction types?
-
What was the average fine amount for drivers who never attended traffic school?
In the first stage, we'll use Tableau Prep Builder to restructure the data for our analysis. In the second stage, Analysis with the Second Date in Tableau Desktop, we'll move on to analysis in Tableau Desktop.
The goal of this tutorial is to present various concepts in the context of a real-life scenario and work through options—not prescriptively establishing which is best. At the end, you should have a better sense of how data structure impacts calculations and analysis, as well as greater familiarity with various aspects of Tableau Prep and calculations in Tableau Desktop.
Note: To complete the tasks in this tutorial, you need Tableau Prep Builder (installed or via the browser) and the data downloaded. For the second portion, you'll also need Tableau Desktop installed.
The data set is Traffic Violations.xlsx. It is recommended to save it in your My Tableau Prep Repository > Datasources folder.
To install Tableau Prep Builder and Tableau Desktop before continuing with this tutorial, see the Tableau Desktop and Tableau Prep Deployment guide(Link opens in a new window). Otherwise you can download the Tableau Prep(Link opens in a new window) and Tableau Desktop(Link opens in a new window) free trials.
The Data
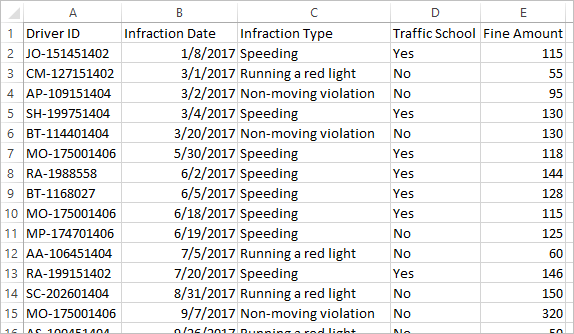
For this example, we're looking at traffic infraction data. Each infraction is a row. The driver, date, type of infraction, if the driver was required to attend traffic school, and fine amount are recorded.
Desired Data Structure
The data is currently structured such that each infraction is a row. A driver with multiple infractions appears on multiple rows, and there's no easy way to tell which was their first or second infraction.
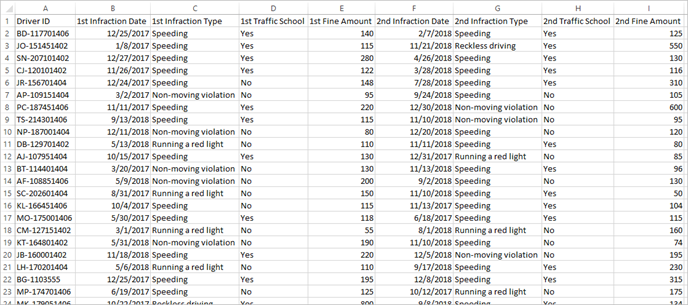
To investigate our repeat offenders, we want a data set that separates out the first and second infraction dates, and the information associated with each of those infractions, and each row is a driver.
Restructuring the Data
So how do we get there with Tableau Prep? We'll build out the flow in stages, beginning with pulling out the first infraction date, then the second, then shaping the final data set as desired. Make sure you've downloaded the Excel file (Traffic Violations.xlsx) to follow along.
Initial Aggregation for 1st Infraction Date
First, we'll connect to the Traffic Violations.xlsx file.
-
Open Tableau Prep Builder.
-
From the start screen, click Connect to Data.
-
In the Connections pane, click Microsoft Excel. Navigate to where you saved Traffic Violations.xlsx and click Open.
-
The Infractions sheet should automatically be brought out to the Flow Pane.
For more information about connecting to data, see Connect to Data.
Next, we need to identify the first infraction date per driver. We'll use an Aggregate step to do this, creating a mini data set of Driver ID and Minimum Infraction Date.
When using an Aggregate step in Tableau Prep, any field that should define what makes a row is a Grouped Field. (For us, that's Driver ID.) Any field that will be aggregated and presented at the level of the grouped fields is an Aggregated Field. (For us, that's Infraction Date).
-
In the Flow pane, select Infractions, click the plus
 icon, and select Aggregate.
 -
Drag Driver ID to the Grouped Fields drop area.
-
Drag Infraction Date to the Aggregated Fields area. The default aggregation is CNT (count). Click CNT and change the aggregation to Minimum.
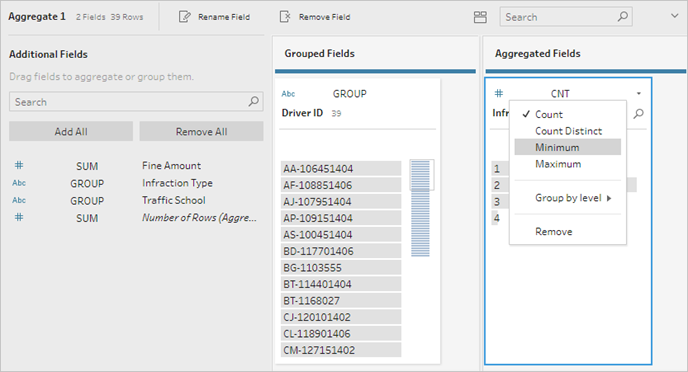
This identifies the smallest (earliest) date, which is the first infraction date per driver.
For more information about aggregations, see Clean and Shape Data.
-
In the Flow pane, select Aggregate 1, click the plus
icon, and select Clean Step so we can clean up the output of the aggregation. -
In the Profile pane, double-click on the field name Infraction Date and change it to 1st Infraction Date.
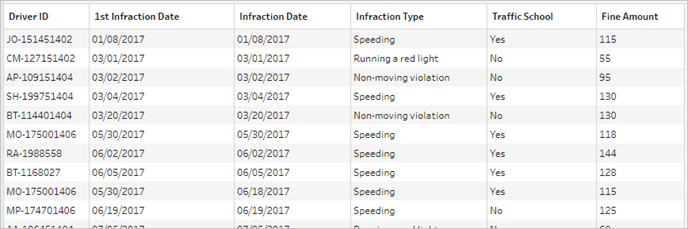
At this stage, the flow and profile pane should look like this:
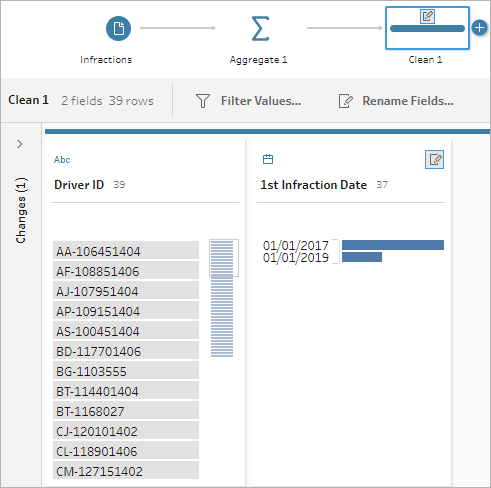
From the Profile pane in this Clean step, we can see that our data now consists of 39 rows and only 2 fields. Any field not used for grouping or aggregation is lost. But we want to be able to keep some of the original information. We could either add those fields to the grouping or aggregation (but doing so would change the level of detail or require the fields to be aggregated), or join this mini data set back to the original (essentially adding a new column to the original data for 1st Infraction Date). Let's do the join.
-
In the Flow pane, select Infractions, click the plus
icon, and select Clean Step. Make sure you hover over the Infractions step directly, not the line between it and the Aggregation step. If the new Clean step is inserted between the two rather than branching, use the Undo arrow in the tool bar and try again. The menu should say Add not Insert.
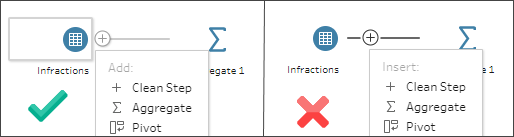
This branches your flow with all the original data. We'll join the results of the aggregation to this copy of the full data. By joining on Driver ID, we're adding the minimum date from our aggregation into the original data.
-
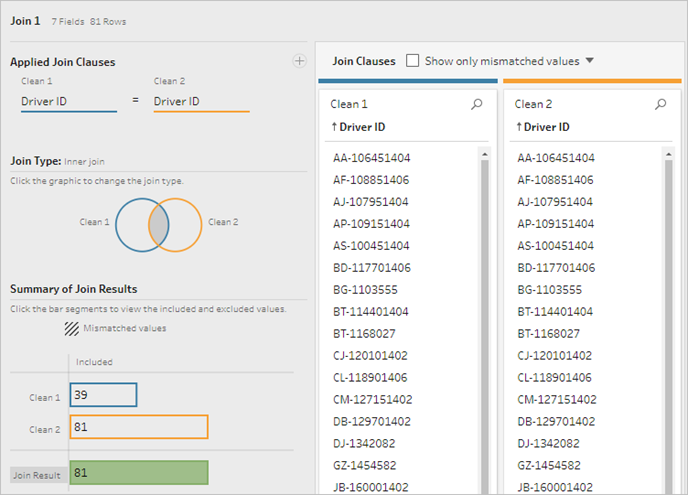
Select step Clean 2 and drag it on top of step Clean 1, and drop it on Join.
-
The default join configuration should be correct: an inner join on Driver ID = Driver ID.
For more information about joins, see Join your data.
Because some fields may be duplicated during a join—such as the fields in the join clause—it's often a good idea to clean up extraneous fields after performing a join.
-
In the Flow pane, select Join 1, click the plus
icon, and select Clean Step. -
In the Profile pane, right-click or Ctrl -click (MacOS) the card for Driver ID-1, and select Remove .
-
To change the field order, drag the 1st Infraction Date card between Driver ID and Infraction Date where you see the black line appear.
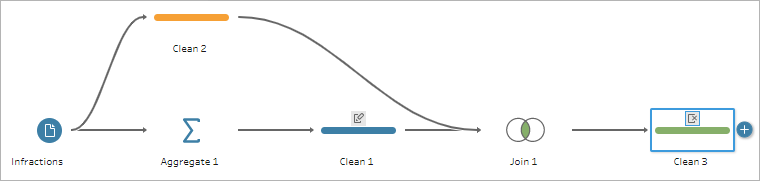
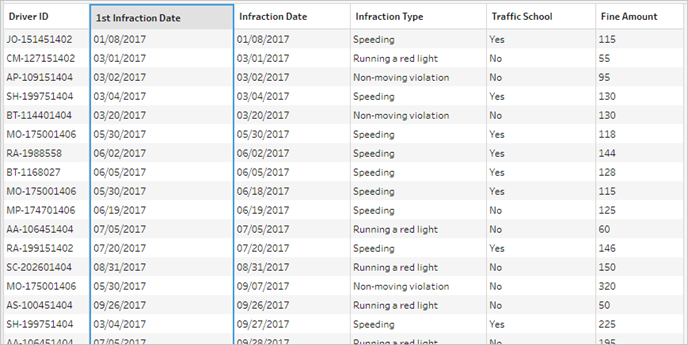
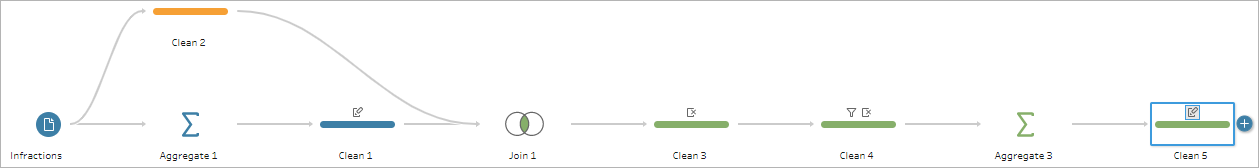
At this stage, the flow should look like this:
Looking at the data grid below, we can see our new, combined data set. We have the minimum—that is, first—infraction date for each driver added to each row in the data set.
Second Aggregation for 2nd Infraction Date
We need to also determine the second infraction date. To do this, we want to filter out any row where the infraction date is equal to the minimum—thus removing the first date. We can then take the minimum of the remaining dates using another aggregate step, leaving us with the second infraction date, which we'll rename for clarity.
Note: Because we'll want to use the data as it currently is in Clean 3 later on in the flow, we'll add another Clean step to get the second infraction date. This will leave the current state of the data in Clean 3 available later on.
-
In the Flow pane, select Clean 3, click the plus
icon, and select Clean Step. -
On the toolbar in the Profile pane, choose Filter Values. Create a filter
[Infraction Date] != [1st Infraction Date]. -
Remove the field 1st Infraction Date.
-
In the Flow pane, select Clean 4, click the plus
icon, and select Aggregate. -
Drag Driver ID to the Grouped Fields drop area. Drag Infraction Date to the Aggregated Fields area and change the aggregation to Minimum.
-
In the Flow pane, select Aggregate 2, click the plus
icon, and select Clean Step. Rename Infraction Date to 2nd Infraction Date.
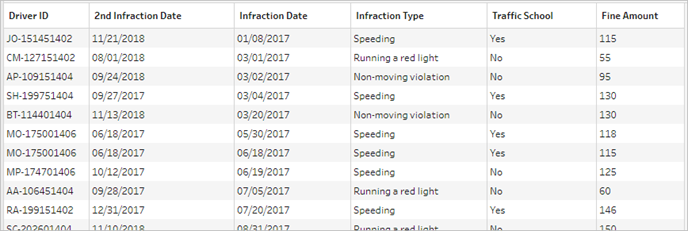
At this stage, the flow should look like this:
We now have our second infraction date identified for each driver. To get all the other information associated with each infraction (type, fine, traffic school) we again need to join this back to the entire data set.
-
Select Clean 5 and drag it on top of Clean 3, dropping it on Join.
-
Again, the default join configuration should be correct: an inner join on Driver ID = Driver ID.
-
In the Flow pane, select Join 2, click the plus
icon, and select Clean Step. Delete the fields Driver ID-1 and 1st Infraction Date as they are no longer needed.
At this stage, the flow should look like this:
Create full data sets for the 1st and 2nd infractions
Before we go any further, let's step back and think about everything we have and how we want to bring it all together. Our desired end state is a data set that looks like this, with a column for Driver ID, then columns for date, type, traffic school, and fine amount for the 1st and 2nd infractions.
How do we get there from here?
In the step Clean 3, we have our compete data set with a column that repeats the first infraction date for each driver.
We want to eliminate all the rows for a driver that aren't the first infraction, building a data set of only first infractions. That is, we only want to keep the information for a given driver when 1st Infraction Date = Infraction Date. Once we've filtered to keep only the row of the first infraction, we can remove the Infraction Date field and tidy up field names.
Similarly, after the second aggregation and join, we have our complete data set with a column for the second infraction date.
We can perform a similar filter of 2nd Infraction Date = Infraction Date to keep only the row of information for each driver's 2nd infraction. Again, we can also remove the now-redundant Infraction Date and tidy up field names.
We'll start with the first infraction data set.
-
In the Flow pane, select Clean 3, click the plus
icon, and select Clean Step. Like in step 10 above, we want to add a branch for the new clean step, not insert it between Clean 3 and Clean 4.
-
With this new Clean step selected, in the Profile pane, click Filter Values in the toolbar. Create a filter
[1st Infraction Date] = [Infraction Date]. -
Remove the field Infraction Date.
-
Rename the Infraction Type, Traffic School, and Fine Amount fields to start with "1st".
-
Double-click on the name Clean 7 under the step in the Flow pane and rename it Robust 1st.
Now for the second infraction data set.
-
In the Flow pane, select Clean 6, after the last join.
-
Click Filter Values in the toolbar. Create a filter
[2nd Infraction Date] = [Infraction Date]. -
Remove the field Infraction Date.
-
Rename the Infraction Type, Traffic School, and Fine Amount fields to start with "2nd".
-
Double-click on the name Clean 6 under the step in the Flow pane and rename it Robust 2nd.
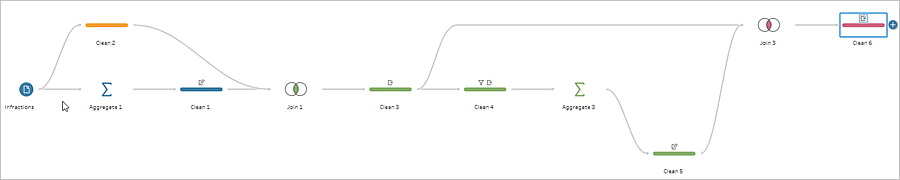
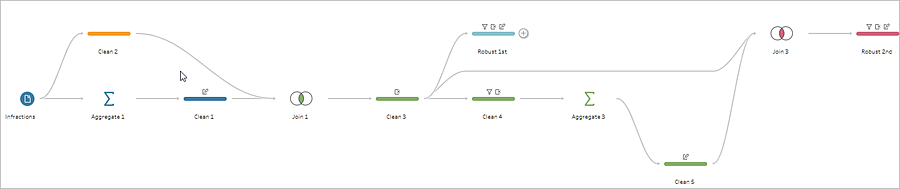
At this stage, the flow should look like this:
Create the complete data set
Now that we have these two tidy data sets with complete information for the first and second infractions per driver, we can join them back together on Driver ID and wind up with our desired data structure.
-
Select Robust 2nd and drag it on top of Robust 1st, dropping it on Join.
-
The default join clause should be correct as Driver ID = Driver ID.
-
Because we don't want to drop drivers who didn't have a second infraction, we need to make this a left join. In the Join Type area, click the unshaded area of the diagram next to Robust 1st, turning it into a Left join.
-
In the Flow pane, select Join 3, click the plus
icon, and select Clean Step. Remove the field duplicateDriver ID-1.
The data is in the desired state, so we can create an output and proceed to analysis.
-
In the Flow pane, select the newly added Clean 6, click the plus
icon, and select Add Output. -
In the Output pane, change the Output type to .csv then click Browse. Enter Driver Infractions for the name and choose the desired location before clicking Accept to save.
-
Click theRun Flow
 button at the bottom of the pane to generate your output. Click Done in the status dialog to close the dialog.
Tip: For more information about outputs and running a flow, see Save and Share Your Work.
The final flow should look like this:
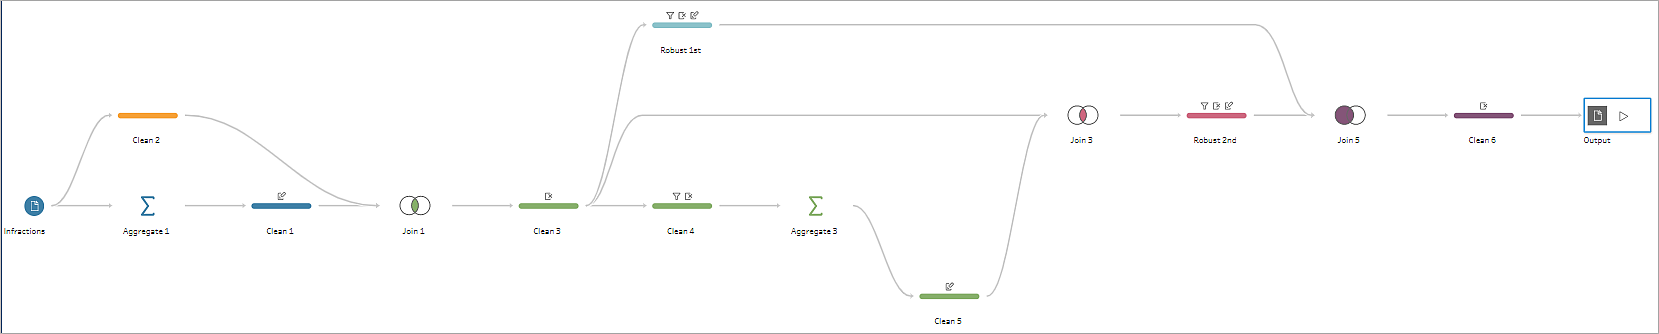
Note: You can download the completed flow file to check your work: Driver Infractions.tflx
Recap
For the first stage of this tutorial, our goal was to take our original data set and prepare it for analysis involving the first and second infraction dates. The process consists of three phases:
Identify the first and second infraction dates:
-
Create an aggregation that keeps Driver ID and MIN Infraction Date. Join this with the original data set to create an "intermediate data set" that has the first (minimum) infraction date repeated for every row.
-
On a new step, filter out all rows where the 1st Infraction Date is the same as the Infraction Date. From that filtered data set, create an aggregation that keeps Driver ID and MIN Infraction date. Join this with the intermediate data set from the first step. This identifies the second infraction date.
Build out clean data sets for the first and second infractions:
-
Go back and create a branch from the intermediate data set and filter to keep only rows where the 1st Infraction Date is the same as the Infraction Date. This builds a data set for just the first infraction. Tidy it up by removing any unnecessary fields and rename all the desired fields (except Driver ID) to indicate they're for the first infraction. This is the Robust 1st data set.
-
Tidy the data set for the second infraction date. Clean the join results from step 2 by filtering to keep only rows where the 2nd Infraction Date is the same as the Infraction Date. Remove any unnecessary fields and rename all the desired fields (except Driver ID) to indicate they're for the second infraction. This is the Robust 2nd data set.
Combine the first and second infraction data into one data set:
-
Join the Robust 1st and Robust 2nd data sets, making sure to keep all records from Robust 1st to prevent losing any drivers without a second infraction.
Next, we want to explore how this data can be analyzed in Tableau Desktop.
Note: Special Thanks to Ann Jackson's Workout Wednesday topic Do Customers Spend More on Their First or Second Purchase?(Link opens in a new window) and Andy Kriebel's Tableau Prep Tip Returning the First and Second Purchase Dates(Link opens in a new window) that provided the initial inspiration for this tutorial. Clicking these links will take you away from the Tableau website. Tableau cannot take responsibility for the accuracy or freshness of pages maintained by external providers. Contact the owners if you have questions regarding their content.