Manage Pools
There are a few ways you can manage your pooled Bridge clients.
Monitor data freshness tasks
You can monitor client activity using a combination of the Jobs page and built-in admin views.
Live queries
To monitor live query activity, you can use the Traffic to Bridge Connected Data Sources admin view.
Refresh jobs
To monitor refresh jobs, you can use the following resources:
-
Jobs page: The Jobs page can show you the completed, in progress, pending, canceled, and suspended Bridge refresh jobs that use Bridge refresh schedules. For more information, see About Bridge Refresh jobs.
-
Background Tasks for Non Extracts admin view: After filtering on Refresh Extracts Via Bridge, this admin view shows Bridge refresh jobs that use refresh schedules. For more information, see Background Tasks for Non Extracts.
-
Bridge Extracts admin view: This admin view shows Bridge refresh jobs that use both Bridge refresh schedules and Bridge legacy schedules. For more information about this view, see Bridge Extracts.
-
Create a data source or view using client logs: Using JSON log files generated by a client, create your own data sources and views to monitor refresh jobs. For more information, see the Refresh jobs by client section below.
Multiple connection scenarios
For Bridge extract refresh connections that contain embedded data sources, you can connect to more than one Bridge client, therefore allowing data from multiple sources to be combined and accessed as if it were a single source. This behavior differs from published data sources.
Multiple published data source connections must be assigned to one Bridge client. Pool mappings that have conflicting connections are not supported.
Scenario 1
Data source 1: Embedded data source for Snowflake that has direct connection to a data source through Tableau Cloud.
Data source 2: Published data source for Snowflake that has a connection to union on-premises databases.
Pool mapping
- For the embedded data sources, don’t add the Snowflake to the Private Network Allowlist. Edit connection type from the Connections tab and set the network type as Tableau Cloud.
- For the Snowflake published data sources that have union connections to on-premise databases, add the connection to the Private Network Allowlist, edit the connection type from the Connections tab, and set the network type as Private Network.
Note: You don’t need to use Bridge if the data source can access Tableau Cloud directly.
Scenario 2: Not Supported
- Published data source with two connections: Connection one is assigned to pool1 and connection two is assigned to pool2.
Refresh jobs by client
As an alternative to monitoring refresh jobs using the admin views listed above, consider creating your own data sources and views to monitor refreshes performed by a Bridge client. You can do this by using Tableau Desktop to connect to a client’s JSON log files on the machine where the client is running.
Note: A client's JSON log files do not capture refreshes for virtual connections.
The JSON log files are comprised of objects, “k” and “v”. The “k” objects capture refresh jobs and “v” objects capture refresh details. The refreshes and their details include:
- Schedule type - Bridge refresh or Bridge legacy
- Data source type and name
- Refresh start and end time, duration, time to upload and publish
- Errors
Step 1: Before you begin
If you want to build a view from the data of one log file, you can skip to Step 2.
If the data for a client is in multiple log files, you’ll need to union the files. You can create a script to union the log files locally or use Tableau Desktop to perform the union as described in the procedure below.
Notes:
- The procedure described below assumes you are running Tableau Desktop on the same machine as the client.
- If you are working with multiple log files from different clients in a pool, in addition to unioning multiple logs files for a client, you can join the log files from multiple clients to monitor refreshes in a pool.
- Connecting to JSON files directly from Tableau Cloud web authoring is currently not supported. For more information, see Creators: Connect to data on the web(Link opens in a new window).
Step 2: Connect to JSON logs
To build a data source and view, connect to a client’s log files using Tableau Desktop.
-
Start Tableau Desktop and under Connect, select JSON file. Do the following:
- In the Select Schema Levels dialog box, select the top level schema to include “k” object details and optionally, select the "v"-level schema to include "v" object details, and then click OK.
- Navigate to the log file you want to connect to (for example, C:\Users\jsmith\Documents\My Tableau Bridge Repository\Logs), select it, and then click Open.
-
(Optional) On the data source page, right-click the log files and click Convert to Union to set up a union. Do the following:
- Select Wildcard (automatic) tab.
- Next to Search In, verify the path shows the client’s Log folder.
- Under Matching pattern, enter ExtractRefreshMetrics_* and click OK.
-
Select the sheet tab to start your analysis and build your view.
-
When finished, publish the data source and view to Tableau Cloud separately. To ensure that your data source is kept up to date, you can set up a Bridge (legacy) schedule for the data source after publishing.
Be aware that the data sources and views you create can change without warning because new log files can be generated and old log files can be deleted after certain log-specific limits are met. For more information about these limits and how to adjust them, see Change the Bridge Client Settings.
Manage pools and clients
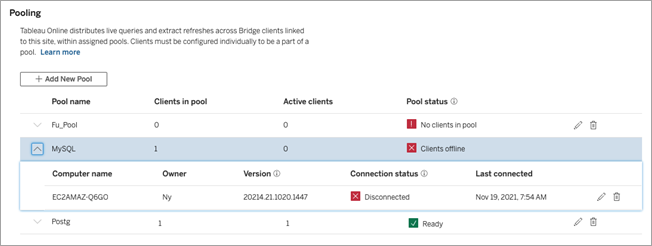
Under the Pooling section, you can see up to five tables of pooling and client related information in your Bridge deployment.
About pools
The first table consists of clients registered to the site organized by the pools they are assigned to.

The second table, Unassigned Clients, shows clients not assigned to a pool. In most cases, these clients need to be assigned to a pool before they can load balance live query and extract refresh jobs. In other cases, clients in this table might be dedicated to refreshing data sources using Bridge (legacy) schedules.

The third table, Default Pool, shows clients in the default pool. Clients configured to use pooling prior to Bridge 2021.4 are included in this pool by default. Because the default pool's domain can't be configured to access a specific private network, we recommend you reduce its scope of access by creating new pools and mapping them to specific domains.

The clients you see in the first three tables can tell you the following information:
-
Client name, also known as the computer name, is the name of the machine the client is installed on and running from.
-
Owner name, which in most cases is a site admin. This is the user who is authenticated (signed in) to Tableau Cloud from the client.
- Pool status, applies to the first table only, can indicate 1) whether there are assigned clients in the pool, 2) clients are connected and available to handle data freshness tasks, or 3) pool is offline because all clients int he pool are disconnected.
-
Client version:
-
A warning icon (
 ) displays in this column when the client is not running the latest version of Bridge. Although not required, we strongly recommend upgrading to take advantage of the latest security and feature updates. To download the latest version of Bridge, go to the Downloads(Link opens in a new window) page on the Tableau website.
Note: The warning icon shows only when there is a newer client available for download. The warning icon is not an indication that there are issues with the client or related Bridge data sources or virtual connections.
-
-
Connection status—for more information see the Client connection status, below.
-
Last connected—shows the day and time Tableau Cloud was last able to reach the client.
About Private Network Allowlist
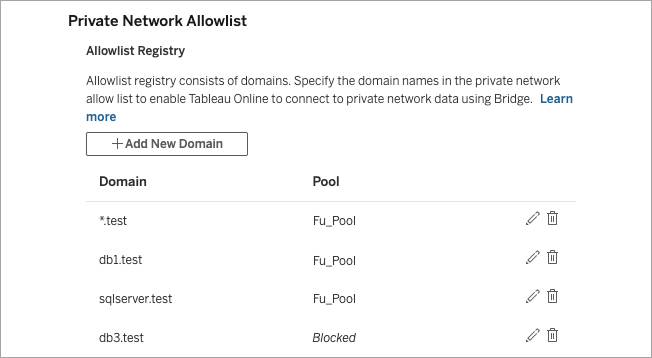
The fourth table, Allowlist Registry, contains a list of domains that pools are scoped to.

The fifth table, Allowlist Requests, shows pending domains that users have requested to connect to when trying to create virtual connections. These domain requests should be addressed as soon as possible to unblock users from their virtual connection workflows.
Client connection status
Where clients are listed, the colored squares and status labels indicate the availability of the client to support data freshness tasks.
-
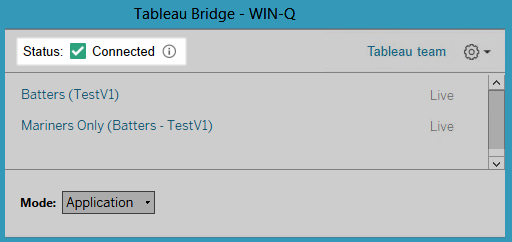
Green or "Connected": A green or Connected state indicates that the client is connected and available to support live queries and extract refreshes.
-
Red or "Disconnected": A red or Disconnected state can indicate one of a few conditions that have temporarily put the client in a disconnected state. The most common scenario is if the client is not running or was unable to establish communication with Tableau Cloud after being launched. You can hover over the status to see a tooltip that describes the condition.
Notes: When the client is in a disconnected state, live queries might be disrupted. In cases like this, views that depend on data sources or virtual connections with live queries might not properly display until the issue is resolved.
The states described above reflect and correspond to the status you see in the client.

