Understanding Salesforce and Data Cloud Terms
As of October 14, 2025, Data Cloud has been rebranded to Data 360. During this transition, you may see references to Data Cloud in our application and documentation. While the name is new, the functionality and content remains unchanged.
As Tableau Next and Tableau(Link opens in a new window) continue to build stronger integrations, we're adding the ability to do analysis where you want regardless of where your data lives. This means Tableau and Data Cloud terminology and philosophies are beginning to touch more. Users who are familiar with one ecosystem may find the other ecosystem confusing or alien, but at the end of the day it's all data.
This topic is intended to help orient users regardless of which system they're used to or find themselves working in.
Note: Data 360 was formerly "Data Cloud."
Essential data terms and concepts
There are plenty of words to describe data. In the most generic sense, a data set is the collection of data you're working with.
- A database is the technology platform that actually holds the data, such as Amazon Redshift, Firebird, Google Sheets, or Oracle.
- Data is often stored as a table of data. In a database, there may be multiple tables or views. In Excel or Google Sheets, each sheet tab is a table. In a csv file, the entire file is the table.
- If the data you need is spread across multiple tables, they need to be connected in a data model. A data model is the abstract representation of how tables are connected to each other.
Data in Salesforce
In Data 360, data is broken down into different concepts.
| Data Type | Description |
|---|---|
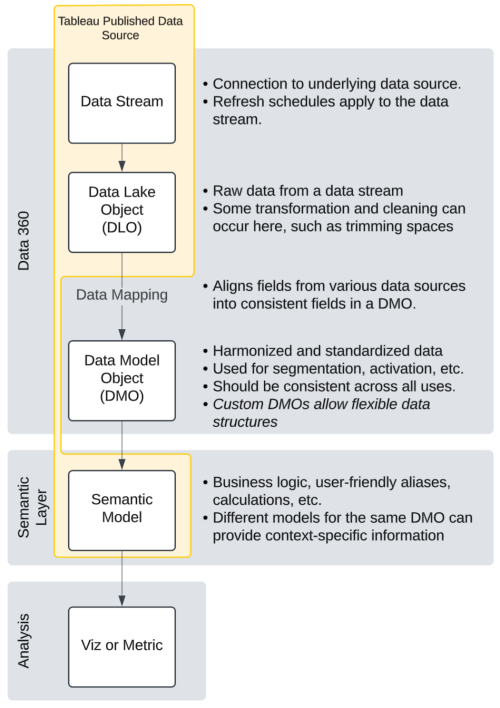
| Data stream(Link opens in a new window) |
The connection information, such as original source (S3, Amazon, Google BigQuery, etc), as well as which fields are brought in, which field is the primary key, how often the data is refreshed, etc. |
| Data lake object (DLO)(Link opens in a new window) |
Data ingested into Data 360 or referenced from an external system such as Snowflake gets stored in a DLO. The data stored in a DLO is cleansed, transformed, and prepped for computation and analysis. Each table of data is its own DLO. |
| Data model object (DMO)(Link opens in a new window) |
A Data 360 object that describes the structure and schema of data stored in one or more data lake objects. A DMO is a table of data, but it might come from one or more DLOs. The DMO takes the DLO data and maps it into a reliable format. Identity resolution rulesets and other templatized formatting is applied in the DMO. There are standard and custom DMOs. The data mapping(Link opens in a new window) from a DLO to a DMO and the templatized nature of most DMOs is the harmonization power of Data 360. |
| Calculated insight object (CIO)(Link opens in a new window) | A data model object created after a calculated insight is processed. Calculated insights help build cube-style metrics with measures and dimensions on Data 360 data. You can connect to an existing CIO in Data 360 and add it as a data asset in your workspace. |
| Comma-separated value (CSV)(Link opens in a new window) |
A text file that stores data in a table-like format. CSV files are commonly used to move data between applications and programs. For Tableau Next: A CSV file can be brought into a Tableau Next workspace and the data uploaded and stored in Data 360 as a DLO. |
An aside on Salesforce Data Objects for the Tableau audience
The data stream is the connection information.
The DLO is the raw dump of data from the data stream. Each DLO is a single table.
A DMO has no direct analog in Tableau. A DMO can be mapped from multiple DLOs (similar to a "view" in a database) and each DMO is a single table.
A CIO has no analog in Tableau where calculations are simply fields in the data source like any other.
Data in Tableau
A Tableau Data Source(Link opens in a new window) consists of database connection information, the data model, info about how to access the data (access credentials, etc) or refresh it, semantic information, and possibly even the data itself. The two main UI elements for creating and editing a data source are the data source tab and the Data pane.
Data source tab: The data source tab is where the data connections are established to the underlying database or files and the data model is built by combining tables from one or more databases into a single data source using relationships, joins, and unions(Link opens in a new window). If the data is left in its original database, it's a live connection. A copy of the data can also be brought into Tableau itself as an extract that can be refreshed if desired.
Data Pane: The Data pane is where semantic information is captured, including field names, member aliases, hierarchies, groups, sets, calculations, default aggregations and colors, and field descriptions.
Data source: Together, the modifications made in the data source tab and the Data pane form the data source. A data source can be a published asset, a file, or contained within the workbook it was created in.
- A published data source (PDS) is a standalone asset on Tableau Cloud or Tableau Server.
- Locally, you can also have file-based versions of a Tableau data source:
.tdsis the file extension for a Tableau Data Source, which contains the non-data information (connection and semantics alone)..tdsxis the file extension for a packaged Tableau Data Source, which contains the non-data information as well as the data itself..hyperis the file extension for an extract (previously.tde), which contains a copy of the data (the data itself).
Note: A published data source is the closest equivalent Tableau has to a semantic layer or semantic model.
An aside on Tableau data for the Salesforce audience
Tableau works with data from a wide variety of databases and technologies, both local and cloud-based. Because data isn't coming from a Salesforce cloud with all the specific data objects that implies, there's a lot of flexibility in how to model and format data and no real concept of templatized data formats.
Standardization and semantic models are mostly captured with published data sources (PDS).
Essentials of data semantics
- Data is the raw facts (numbers and observations and measurements).
- Information is the interpretation of that data or the knowledge that comes from processing and understanding the data.
- Semantics is the stepping stone between the underlying data and the information that comes out of it.
The term comes from the linguistic concept of semantics vs syntax. Syntax is how you say something, semantics is what it means. That concept of semantics is what it means carries through to semantics in the context of data. Semantics includes things like how tables are combined in the data model, information about the fields or columns of data and how they might interact with each other, additional information such as default aggregation, and calculations performed on top of the raw data.
A data set might have all the information you need, but if you can't figure out how to get meaning out of it, it's useless(Link opens in a new window). It needs semantics to be useful.
The business use case can't be separated from the details of semantics. Semantics is the description of the data or its business context. Semantics can be broken down into categories such as data modeling; field metadata and descriptions; default aggregations; hierarchies, groups, and sets; and calculations.
Some examples:
- Data modeling
- How the tables of data could connect to each other. Should the four quarterly sales tables be unioned? Should the doctor table be directly related to the patients table, or should they both be related to the appointments table?
- Field metadata (field name, data type, member aliases)
- Is Name the name of an account or a contact?
- Is Discount a boolean field for whether or not a discount is applied, a string field of the discount type, or a discrete measure of the discount amount?
- Field descriptions
- Such as a comment that APR for this data set is Adjusted Pitching Runs, not Annual Percent Return, and it's calculated as
APR = L * IP - R / pf(P)where L: Average number of runs per inning pitched in the league, IP: Innings Pitched, R: Runs Allowed, pf(P): park factor for the player's home park P.
- Such as a comment that APR for this data set is Adjusted Pitching Runs, not Annual Percent Return, and it's calculated as
- Default aggregations
- Should Listings be aggregated as a COUNT (counting every instance) or COUNTD (counting only unique values)?
- Should the default aggregation of a measure be SUM or AVG?
- Hierarchies, sets, groups
- In a collection of departments at a university, the engineering department may be its own college, where the departments of history, literature, philosophy, and political science may all form the college of Liberal Arts.
- Calculations
- Fields that are derived from fields that exist natively in the data but need to be manipulated or combined, such as defining a stale support case as one that's been open for 10 days for a standard account but only 2 days for a premium account.
Semantics in Tableau and Tableau Semantics
Without a reusable semantic layer, data models, semantic definitions, and calculated fields may be made as one-offs over and over, introducing inefficiencies and the potential for error or misalignment.
Semantics in Tableau
Semantics isn't anything new to the Tableau audience. It's just been part of the data source—especially a published data source (PDS). The published data source is where you control the semantic definitions of your data.
Because of Tableau's philosophy of the cycle of visual analytics(Link opens in a new window), semantics historically hasn't been abstracted out into a distinct layer. The authoring environment is the place where the data model (the data source tab) and semantics (the Data pane) are developed together.
Tableau Semantics
Tableau Semantics(Link opens in a new window), takes the approach of separating semantics into a distinct layer from analysis so that semantic models can be built once and used across a variety of analyses or even products. Tableau Semantics fits into the Data 360 and Tableau Next environments as a stand-alone semantic layer distinct from the data or analysis. The unit of the semantic layer is a semantic model. The semantic model contains both the data model and semantic definitions for the data. In Tableau Semantics, the Semantic Model Builder is the UI for creating a semantic model. These semantic models can be built in Data 360 or Tableau Next.
Interoperability
With the Tableau Semantics connector for Tableau, you can do analysis in Tableau using a semantic model from Tableau Next. Or, by creating a semantic model from a published data source (PDS)(Link opens in a new window), you can do analysis in Tableau Next using a data source from Tableau.