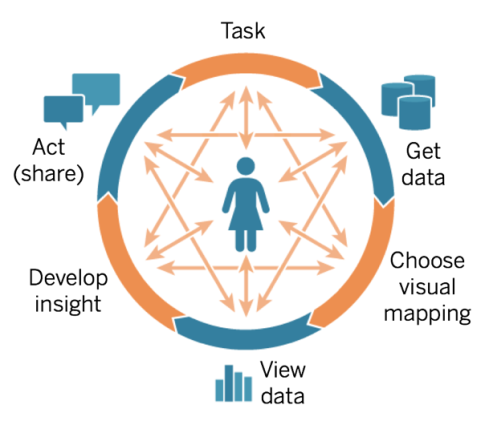
The Cycle of Visual Analysis
This content is part of Tableau Blueprint—a maturity framework allowing you to zoom in and improve how your organization uses data to drive impact. To begin your journey, take our assessment(Link opens in a new window).
Visual analysis is a non-linear process. For example, a user might start with an initial task or question in mind, find relevant data, and prepare it for analysis. During analysis, she realizes that she needs additional data, so she goes back a couple of steps to get more data, choose a new visual, and develop a new insight. This example can be repeated for any of the other steps of the cycle of visual analysis.
The flow of analysis is difficult or impossible to achieve in traditional BI. Instead of exploiting the power of visual cues and iteration, it’s heavily milestone-driven. Requirements gathering leads to development, then to testing, and eventually to launch. With visual analysis, the steps become more fluid as the answer to one question often leads to other questions, and new insights are uncovered.
Start with Questions
Whether you’re authoring for yourself or for others, the cycle of visual analysis starts with a task or business questions to be answered. When asking data questions, start with a broad topic then add specificity to each question. For example, a call center manager’s questions from summary to detail might look like:
- How many calls are received monthly?
- Where do the calls come from?
- What are the top call types?
- Who answers the most/least calls?
Often the person analyzing the data also understands the underlying business questions. In other cases, someone might come to you with a need for a dashboard and what business questions it needs to address. Regardless of what the process of requesting this kind of assistance is, the steps for success are similar.
- Build rapport for a productive working relationship built on trust. Find out about their experiences and try to speak their language.
- Ask open-ended questions like "What do you want this dashboard to tell you?" or "What question do you want to answer?" rather than "Do you want a line graph?" or "Should I make a trend line?"
- Use examples: Show existing dashboards and ask what would make them better.
Get Data
Your users have questions that can be answered with data, but do they know how to find and connect to the right data? Knowing where to get the right data is one of greatest barriers to becoming a data-driven organization.
During the discovery process, the Tableau Data and Analytics Survey in the Tableau Blueprint Planner identified key sources of data and how data is distributed and consumed within each department or team. With specific sources of data documented on the Tableau Use Cases and Data Sources tab of the Tableau Blueprint Planner, you should prioritize which ones will be most impactful by audience size and create Published Data Sources in Tableau Server or Tableau Cloud.
Beyond the initial use cases, content creators should understand how to get data to answer new business questions. Using the Data & Analytics Survey is a repeatable way to discover new use cases and assess whether the needed data exists already in Tableau Server and Tableau Cloud. If it's already available as a Published Data Source, then content creators can connect to it and begin analyzing it. If it doesn't exist, authors should collaborate with Data Stewards and work with the data they have—even sample data files—and prototype with the data available, rather than waiting to proceed with a perfect dataset. After the full dataset is available, the full dataset replaces the sample.
Choose Visual Mapping
After getting data, content creators will start to explore data by adding measures and dimensions to the view, and Tableau presents users with the most effective visualization. At any time in the authoring of content, the type of visualization can be changed. As creators explore the data and visually encode it with the pre-attentive attributes, they’ll be able to derive insights from it.
Choosing the appropriate type of visual mapping for the type of analysis is critical for deriving insights and driving towards action. There are five primary types of visual mappings that content creators and consumers should understand:
- Comparison, represented as a bar
- Spatial, represented as a map
- Temporal, represented as a line
- Compare two measures, represented as a scatterplot
- Precise number, represented as a text table
View Data
Tableau visualizations often show the unexpected—relationships, outliers, and trends. A surprise finding stimulates the thought process, encouraging deeper analysis or a different path of exploration. Tableau’s interaction model is based on the concept of incremental change: Whenever you perform an action (e.g., filter), Tableau instantly shows you the new result.
Why is incremental change important? It lets us intuitively explore a broad space of possible visualizations to find the right one. It allows us to focus on the exploration task, where questions lead not just to answers but also to more questions. It also lets us learn visual analytics at our own pace. We can build sophisticated representations of data slowly and incrementally as we learn how to look at information. Tableau’s interface is based on the process of incrementally refining a question into an answer. Every Tableau user, not just analysts, to be able to derive meaningful information from data and base their decisions on data.
Develop Insights
Data analysis and data visualization were once separate tasks. An analyst would run queries or write calculations to get answers from a data source, and then export results as a specified chart or graph. But by making the process querying data visual, you explore your data in a richer, more meaningful way. With visual analytics you can build an analysis and learn from it simultaneously as opportunities for further investigation present themselves.
Critical thinking with data is about finding insight, and communicating the insights in an optimal, engaging way. Visual analytics makes asking and answering questions of your data intuitive, regardless of whether you’re a creator or a consumer—as we continue to ask “why.”
Critical thinking with data is important to the decision-making process for both content creators and information consumers. Both groups should ask themselves these questions as they develop insights:
- What question should I ask?
- And when I get the answer, do I trust it?
- Do I have the ability to question if my data is useful? If it’s correct?
- Am I using all the facts? Am I trying to confirm biases I have?
Act (Share)
Shared findings lead to actions, results, and solutions. In fact, unshared discoveries are useless. You can share different types of content via Tableau Server or Tableau Cloud:
- Tableau Prep Flows: Prep flows can be published to Tableau Server or Tableau Cloud and scheduled to run when you need them to with Prep Conductor.
- Published Data Sources: You can publish data sources that others can use to build new workbooks. A data source can contain a direct (or live) connection to your database or an extract you can refresh on a schedule. For more information, see Best Practices for Published Data Sources and Enabling Governed Data Access with Tableau Data Server.
- Workbooks: Workbooks contain your views, dashboards, and stories, and data connection. You can include local resources, such as background images and custom geocoding, if they reside in a location that the server or other Tableau users can’t access.
A dashboard checklist is a useful resource to make sure that published content meets the purpose and answers the business questions intended. Data stewards also play a role to ensure correctness and review an embedded data source as a potential candidate for publishing and certifying. Beyond data and calculation correctness, content validation should also include a review of the branding, layout, formatting, performance, filters, dashboard actions, and edge case behaviors by the Site Administrator or Project Leader site roles. For more information on content validation, promotion, and certification, see Tableau Governance.