Step 1: Connect to your data
Your manager has asked you to look into the overall sales and profitability for the company and to identify key areas for improvement. You have a some data, but you aren’t sure where to start. You decide to begin by downloading Tableau Desktop Free Edition.
Open Tableau Desktop and begin
The first thing you see after you open Tableau Desktop is the Start page(Link opens in a new window). Here, you select the connector Tableau needs to access your data.
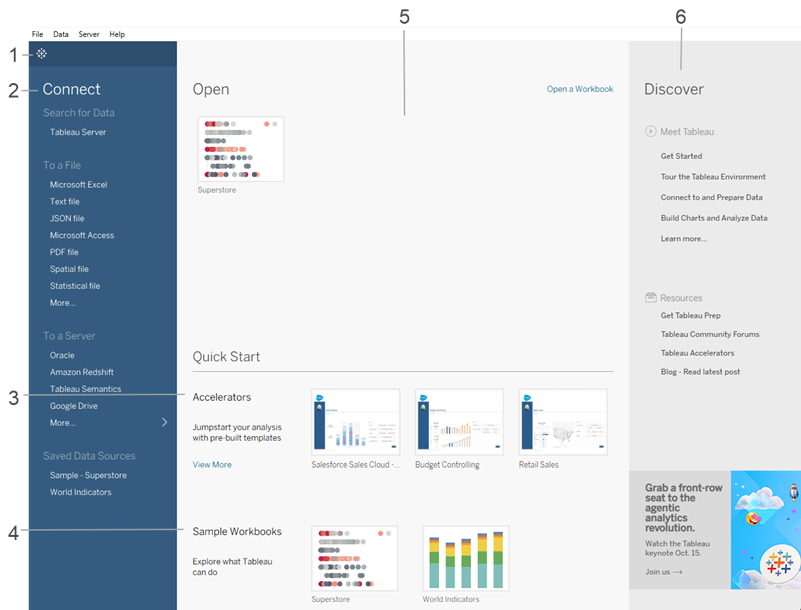
The start page has several options to choose from:
 in the upper left corner of any page to toggle between the start page and the authoring workspace.
- Connect to data in a file, such as Microsoft Excel, PDF, Spatial files and more.
- Connect to data in a server-based platform such as Google Drive, Amazon Redshift, Oracle or a published data source in Tableau Cloud or Tableau Server.
- Connect to a data source you’ve connected to before.
Tableau supports the ability to connect to a wide variety of data stored in a wide variety of places. The Connect pane lists the most common places that you might want to connect to, or click the More links to see more options. For more on connecting to data sources, see the Learning Library for this tutorial.
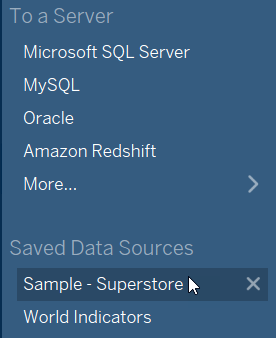
In the Connect pane, under Saved Data Sources, click Sample - Superstore to connect to the sample dataset. Superstore contains information about products, customers and sales that you can use to identify key areas for improvement within this fictitious retail company.
If you need to download the Superstore dataset it can be found on the Tableau Public Sample Data(Link opens in a new window) page, then use the Microsoft Excel connector.
After you select Sample - Superstore, your screen will look something like this:
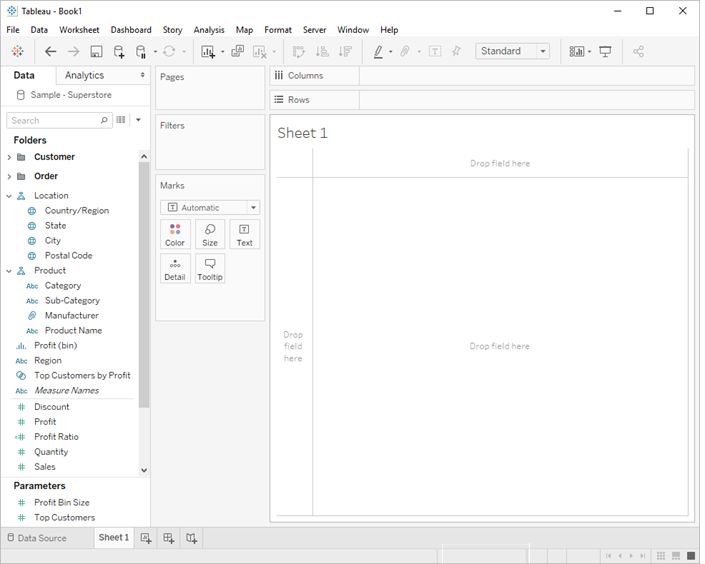
After you connect to your data, Tableau does the following:
Opens a new worksheet. This is a blank slate where you can create your first view.
Displays the data source you are connected to. If you are using multiple data sources, you can see them all listed here.
Adds columns from your data source to the Data pane on the left side. Columns are added as fields.
Automatically assigns data types (such as date, number, string, etc.) and roles (dimension or measure) to your data. (We'll talk more about these terms later.)
If you want to see more details about your data, you can select the Data Source page in the bottom left corner. Here, you can view the first 1,000 rows of your data, and some analysts go nuts: Sort or hide fields, split fields into multiple columns, and rename column headers, all without modifying the original data. What happens in Tableau stays in Tableau; your data is safe.
If you navigated to the Data Source page to check out the details, just click on the tab for Sheet 1 to get back to where you started.
For more information about the Data Source page, see the Learning Library.
When you connect to your own data, you might need to do some prep work before connecting to it in Tableau. This is because Tableau makes assumptions about your data so that it can display it properly for you to work with.
For more information on preparing your data, see the Learning Library.