Tableau Use Cases and Data Sources
This content is part of Tableau Blueprint—a maturity framework allowing you to zoom in and improve how your organization uses data to drive impact. To begin your journey, take our assessment(Link opens in a new window).
To identify initial use cases, the project team should complete the Use Cases and Data Sources Worksheet, found in the Tableau Blueprint Planner, after the Tableau Data and Analytics Survey has been collected for each department/team to discover and prioritize which sources of data will be most impactful for the participating business teams. When prioritizing sources of data to publish and certify on Tableau Server or Tableau Cloud, begin with low complexity and high impact first to demonstrate quick wins. Publish and certify data sources, create workbooks to answer business questions. As new data sources are identified, they can be added over time. Beyond the initial use cases, this provides a repeatable process to add new data sources as the deployment progresses.
Use Cases
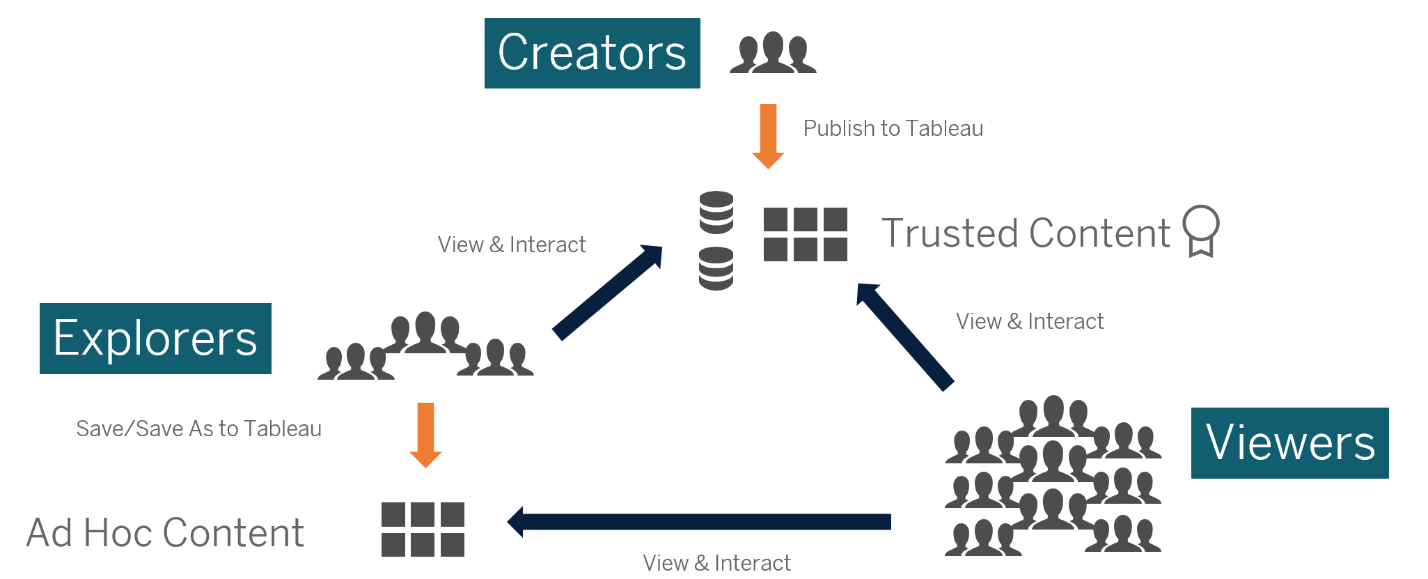
If you are transitioning from a traditional top-down BI approach driven by IT or favor a phased delegation of responsibilities to governed self-service, it is advantageous for IT or a centralized BI team to build the initial use cases across departments, including certified data sources and dashboards.
Over time, as analytical skills increase and users are encouraged to ask and answer their own questions, the domain of available trusted content will grow organically into a wider range of analytic content for self-service.
From Initial Use Cases to Self-Service
Ideas for Initial Use Cases
In addition, Tableau provides Dashboard Starters for popular line-of-business applications to accelerate content authoring. Content consumers can view and interact with the initial use cases while they ramp-up their analytical skills. After they complete some training, the initial use cases can become the starting point for build new content. Some common initial use cases by department are listed below:
- IT — Hardware/software asset inventory, helpdesk call volume/resolution time, resource allocation, security patch compliance
- Finance — Budget planning and spend, accounts payable, travel expenses
- Marketing — Campaign engagement, web engagement, leads
- Human Resources — Turnover rate, open headcount, new hire retention, employee satisfaction
- Sales — Sales/quota tracking, pipeline coverage, average deal size, win/loss rate
- Facilities Operations — Physical locations, call center volume/workload distribution, work request volume/resolution time
For more solutions in industries and departments, see How People Use Tableau.
For CRM Analytics, Analytics Apps Templates are available for certain use cases and industries to accelerate your time to value. These apps are immediately configurable and can be used to create datasets from your data and generate pre-templated dashboards and predictions.
- CRM Analytics Analytics Sales App - Sales Analytics. Sales Analytics brings the power of Analytics to Sales Cloud on any device that supports Analytics. With intuitive visualizations based on your Salesforce data, Sales Analytics lets you move from insight to action quickly and helps you turn data into smarter sales.
- CRM Analytics Services App - Service Analytics. The Service Analytics template gets you started fast with Analytics and provides a clear path through your Service Cloud data on any device. Whether you’re a service manager or agent, you get everything you need in one place to uncover key data insights to help you grow your business.
- CRM Analytics for Financial Services. CRM Analytics for Financial Services gives financial advisors and personal bankers a comprehensive customer intelligence solution based on the CRM Analytics platform. It includes Einstein Discovery, which lets you create automated artificial intelligence models on any dataset without writing code.
- Revenue Operations Analytics. Use the Revenue Operations Analytics template to help sales teams gain performance insights to build stronger pipelines, improve forecast accuracy, and generate more revenue.
- B2B Marketing Analytics App. B2B Marketing Analytics provides advanced analytics for the data-driven marketer, letting you explore both your marketing and sales data in one place. With powerful dashboards that consolidate Pardot and Sales Cloud data, you can quickly explore data, understand the impact of marketing on revenue, and take instant action to drive marketing results.
- Analytics for Retail Banking Template. Analytics for Retail Banking is part of a suite of CRM Analytics apps for Financial Services Cloud customers. Its dashboards visualize all the metrics and key performance indicators (KPIs) personal bankers require to grow client relationships.
- Consumer Banking Starter Analytics Template. Consumer Banking Starter Analytics is part of a suite of CRM Analytics apps for Financial Services Cloud customers. It gives you a quick way of creating an analytics solution personal bankers can use to move clients up the value chain.
More Analytics Apps Templates can be found at Deploy CRM Analytics Prebuilt Apps.