Hardware Monitoring
This content is part of Tableau Blueprint—a maturity framework allowing you to zoom in and improve how your organization uses data to drive impact. To begin your journey, take our assessment(Link opens in a new window).
Any application is only as reliable and performant as the hardware that it runs on. It is important that the underlying infrastructure of your Tableau Server deployment be routinely monitored for capacity constraints to prevent overtaxing the system, whether it’s physical servers or virtual machines, on-premises or in the cloud. Systems administrators should monitor CPU, memory usage, storage I/O, storage space, and network bandwidth utilization.
Tableau Server
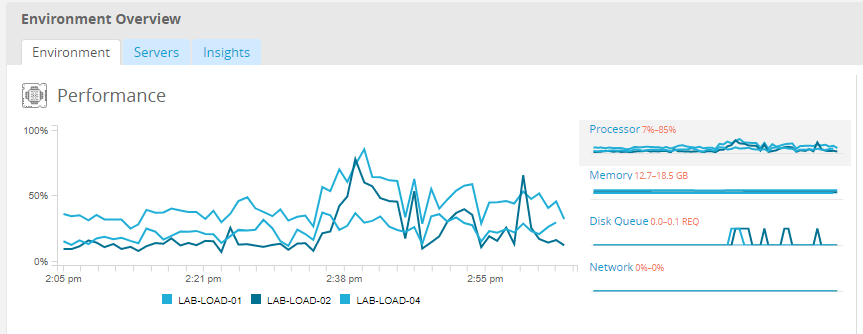
Beginning with 2019.3 and licensed as part of the Tableau Advanced Management, the Resource Monitoring Tool provides a comprehensive look at the health of Tableau Server using a web user interface for all of its features. The Resource Monitoring Tool Agent runs on each of the nodes in your Tableau cluster to monitor their hardware utilization, performance, and activity, which are collated by the Resource Monitoring Tool Master Server. Processor, Memory, Disk Queue, and Network are sampled using WMI several times per second to produce averages. An Environment Down event, which is logged as critical, is monitored at a 15 second polling interval by default and follows a three-strike rule. If the status is offline, or does not reply within 30 seconds, for three consecutive polling intervals then a critical incident is created. For more information, see Performance and Environment Down.
BEST PRACTICE RECOMMENDATION:
To maintain sufficient headroom and reduce the likelihood of resource constraints, calculate the following values based on your hardware specs and set Resource Monitoring Tool Hardware incident thresholds to the following:
- CPU over 80% for 5 minutes
- Memory less than 25% available
- Disk less than 20% available
Depending on your enterprise monitoring approach, hardware monitoring can be done with an agent-based enterprise monitoring service or with PerfMon on Windows (sample workbook). Linux admins will use the sysstat tools or vmstat to collect data to be analyzed in a workbook similar to the Windows version. When deploying on virtual platforms, such as VMware, HyperV, or Citrix, or in the public cloud, including AWS (CloudWatch), Microsoft Azure (Azure Portal), and Google Cloud Platform (Google Stackdriver), these platforms have their own utilities for monitoring the health of their virtual machines. These tools usually have support for automatically monitoring your infrastructure and alerting you when your preset thresholds of 75-85% utilization are exceeded.
Alternatively, TabMon is a freely available open source Tableau Server cluster-monitoring tool. TabMon provides structured output that is analyzed with Tableau Desktop. For more information, watch A Tour of the TabMon Sample Workbook that shows how to monitor CPU, memory usage, storage I/O, storage space, and network bandwidth at the Tableau Server Process level. This information will help you understand when to scale Tableau Server. In the TabMon.config file, you should monitor every 300 seconds and keep data for 30-day intervals to manage the size of the database.
Tableau Cloud
One of the benefits of Tableau Cloud is that it is managed and optimized by Tableau because it is a SaaS analytics platform. If you are connecting to on-premises data, Tableau Bridge availability and activity should be monitored. As a site administrator, you can monitor Tableau Bridge client in a couple of ways:
- Monitor traffic to data sources with live connections using the built-in administrative view
- Monitor client status on the site settings page
- Monitor Bridge extract performance using the built-in administrative view
- Set up data source owners for extract refresh notifications
It’s important to note that data source owners are the users who receive emails when data sources fail. This is especially relevant in the centrally managed model, because the owners of the Bridge clients are the site admins, and it is commonly necessary to get them involved when issues occur and need troubleshooting. Because they will not be automatically notified, data source owners who are not the owner of the Bridge client generally set up automatic email forwarding to site admins to keep them up to date on issues.
As a data source publisher, if you believe an extract is taking an unusual amount of time, there are several things you can do to troubleshoot. An extract refresh through Bridge has two components: taking the extracts locally with Bridge, and then sending that extract to Online and having it become available. To isolate the potential cause of the issue, it may be prudent to take the same extract in Tableau Desktop and compare the extract duration with the time it takes for Bridge to take an extract. Any anomalies there should be reported to your Tableau contact for review and support.