Business Value
This content is part of Tableau Blueprint—a maturity framework allowing you to zoom in and improve how your organization uses data to drive impact. To begin your journey, take our assessment(Link opens in a new window).
By now, you've defined your analytics vision and are ready for the next step. But what do you focus on next?
Let's go back to your organization's original intention—Invest in analytics to drive business outcomes and generate business value or return on investment (ROI). Your team has invested time, resources, and money into analytics, and you'll want to ensure you're receiving the intended benefit from your investment.
Value, however, isn't always top of mind as organizations prioritize and deploy analytics. The impact of not leading with value can be significant, ranging from wasted time and resources to a loss of confidence in analytics overall.
So how do you raise visibility on business value as a priority when deploying a product within the Salesforce analytics portfolio? Simple, by creating a value map. The Analytics Value Map tab in the Tableau Blueprint Planner provides a space for you to draft a value map.
What's a value map? It's a consolidated view detailing how your organization measures the success of the products you deploy. It shows you exactly how you'll reach your business goals and how you'll measure success. Value maps are co-created with your stakeholders to ensure alignment between your collective priorities. It's a living document and will evolve over time.
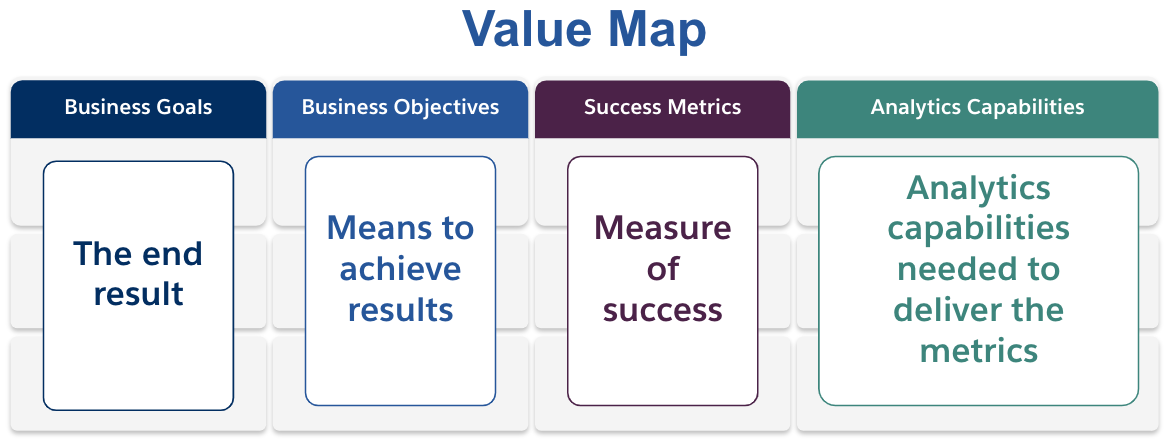
Elements in the value map include business goals, business objectives, success metrics, and analytics capabilities. When creating a value map, it's important to recognize that this is a continuous improvement cycle and the order in which you create and think about the map is important.
-
Determine your business goals—goals inform objectives.
-
Define your objectives—objectives inform metrics.
-
Identify your success metrics—metrics help measure progress and keep you on track.
-
Develop your analytics capabilities—capabilities enable delivery of your metrics.
Let's dive deeper into each element of the value map.
Business goals—the end result your organization expects to achieve, fixed to business impact. Some questions to consider when defining your business goals include:
-
Does it state the business benefit and map to an outcome like revenue, cost, or user experience?
-
Does it indicate the strategy for achieving the benefit like from a certain market, product, technology, customer, or channel?
Examples: "Drive $4.5 billion online revenue by the end of the fiscal year" or "Reduce costs by consolidated technology systems."
Business objectives—the specific methods your organization will employ to achieve your goals. They further detail the strategy specified in your business goal. Some questions to think about are:
-
Does the objective describe how to achieve the goal?
-
Is it clear what will change, typically in terms of people, process, and/or technology?
-
Can your objective be measured? Is it actionable?
Examples: "Increase order value by increasing the average units per transaction" or "Grow email audience by 30% through better lead generation."
Success metrics—quantified indicators that help track progress and ensure your organization moves in the right direction. Use metrics to measure the success of your objectives and goals. Consider the following when establishing your success metrics:
-
Does the metric measure progress on the objective?
-
Can it be measured with reasonable effort over time?
-
Does it measure business or process performance, not completions and other vanity data points (e.g., number of dashboard views)?
Examples: "Email click-through rate" or "First-contact resolution rate."
Analytics capabilities—analytics functionality and technology required to enable delivery of your success metrics. In other words, think of the metrics tied to each business objective. Think about the types of data, analysis, and consumption layers needed to deliver on those metrics. As your organization is mapping this part of the story, you'll want to prioritize and focus on only your most important capabilities. Questions to consider here:
-
Who will interact with the analytics content created?
-
How do these audiences want to consume the analytics content?
-
Do you have the resources and technical capabilities to serve analytics and insights in the places and platforms your audiences want to consume them?
-
Where does your data required for that particular capability live?
-
Who is responsible for creating analytics content?
Examples: "Data-driven alerts" or "Ability to merge data from multiple sources."
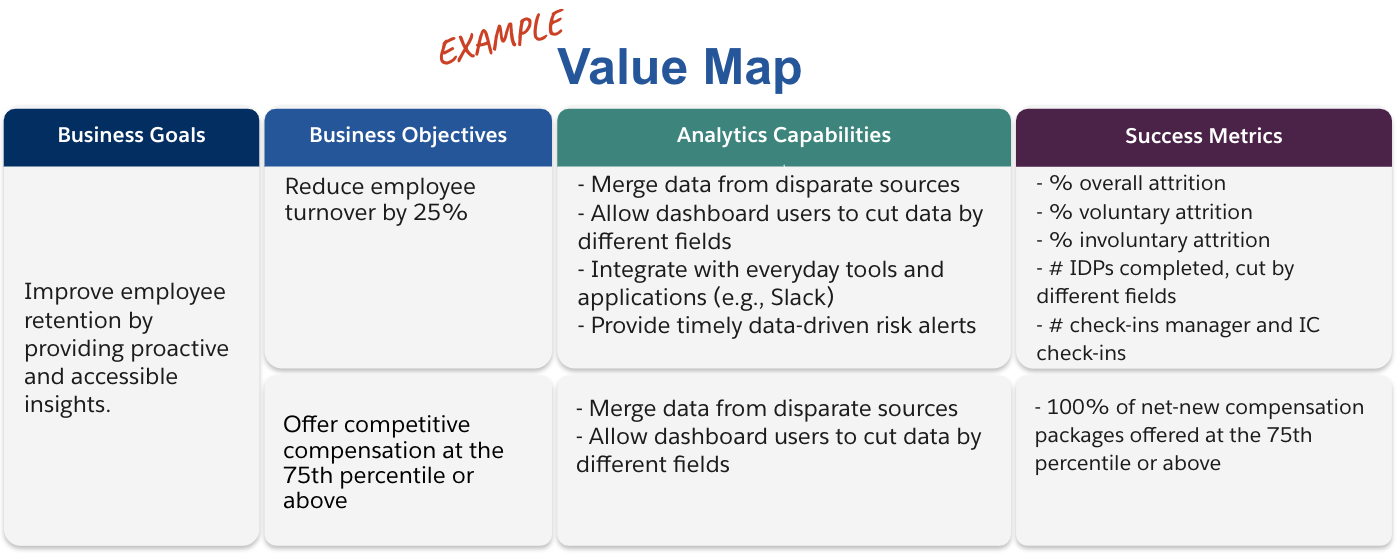
Business Value Example: Superstore HR Data and Analytics Team
Our Superstore HR Data and Analytics Team has defined its analytics vision and is ready to draft a value map for its Tableau investment. While they have many business goals, they decide to focus on their initiative to "improve employee retention." The team reconvenes the original tiger team to draft their business value map.