Don’t Be Scared of Relationships
The new data modeling capabilities create flexible data sources built around relationships.
Relationships combine data from different tables by looking at what columns (fields) those tables have in common to bring information from each table together in the analysis.
Unlike joins or unions, relationships form a data source without flattening multiple tables into a single table. Because of this, related data sources know which table each field is from. That means each field keeps its context, or level of detail. Related data sources can therefore handle tables with different granularity without issues of duplication or data loss.
In a related data source, the joins aren’t fixed up front. Instead of merging all the data (and having to work with all the data regardless of what each viz requires), only the relevant data is combined—per sheet and as necessary. As you drag and drop, Tableau evaluates the relationships of the relevant fields and tables. Those relationships are used to write queries with the correct join types, aggregations, and null handling.
You can think about how the data fits together and what questions you want to answer, rather than how to combine the data or compensate for artifacts from the data source.
Relationships don’t replace the previous ways of combining data: joins, unions, and blends. Rather, relationships are the new, flexible way to bring data together from multiple sources. The existing methods aren’t going away, and are still useful in specific scenarios.
Note: For related information on how relationship queries work, see these Tableau blog posts:
- Relationships, part 1: Introducing new data modeling in Tableau(Link opens in a new window)
- Relationships, part 2: Tips and tricks(Link opens in a new window)
- Relationships, part 3: Asking questions across multiple related tables(Link opens in a new window)
Also see video podcasts on relationships from Action Analytics(Link opens in a new window), such as Why did Tableau Invent Relationships?(Link opens in a new window) Click "Video Podcast" in the Library(Link opens in a new window) to see more.
Use Relationships
This topic walks through building a related data source and using one for analysis. If you would like to follow along, you can download the Bookshop dataset(Link opens in a new window). Choose Bookshop.xlsx for the raw data to start from scratch, or MinimalBookshop.tdsx to start with the related data source basics configured for you.
Note: Relationships are available in Tableau 2020.2 and later.
Video: Migrated Data
If you open an existing workbook from a previous version of Tableau (version 2020.1 or earlier) in Tableau 2020.2 or later, your data source tab might show a Migrated Data table.
There are multiple videos embedded in this topic. For your convenience, a transcript is provided in the expandable section underneath each video.
In a workbook created before relationships were available (before version 2020.2), your data source may look different. If there were joined or unioned tables, they appear as a single logical table named Migrated Data. Double click to see the underlying tables—they’re still there, and your analysis will still behave as expected.
Note that when you’re only using the Migrated Data table, the Data pane behaves more like previous versions of Tableau Desktop.
You can even relate new tables to the directly to the Migrated Data table to extend the data model.
After you’ve added relationships to the data model, the Data pane updates to the new layout, with dimensions and measures maintained within each table, and the Migrated Data table appears as a single, merged table.
Video: Performance Options
Note: The interface for editing relationships shown in this video differs slightly from the current release but has the same functionality.
For any relationship, there are performance options as well as related fields. Tableau automatically chooses safe defaults for these options. However, if you’re sure of the characteristics of your data, changing these options can give Tableau more information about how to best configure automatic joins during analysis. Setting the cardinality and referential integrity options gives Tableau more information about how to optimize queries.
Cardinality
Cardinality indicates whether or not the linking field records are unique. If multiple books can have the same author, but each author is listed only once in the author table, the cardinality for AuthID would be Many for Books and One for Author between those two tables. This setting impacts how Tableau handles aggregation before or after the join.
Referential integrity
Referential integrity indicates whether or not a record in one table is guaranteed to have a relationship in another table. If every book has an author, Book has referential integrity to Author. If not every author has a book, Author doesn’t have referential integrity to Book. This setting impacts how Tableau chooses a join type and handles unmatched records.
For more information, see Cardinality and Referential Integrity.
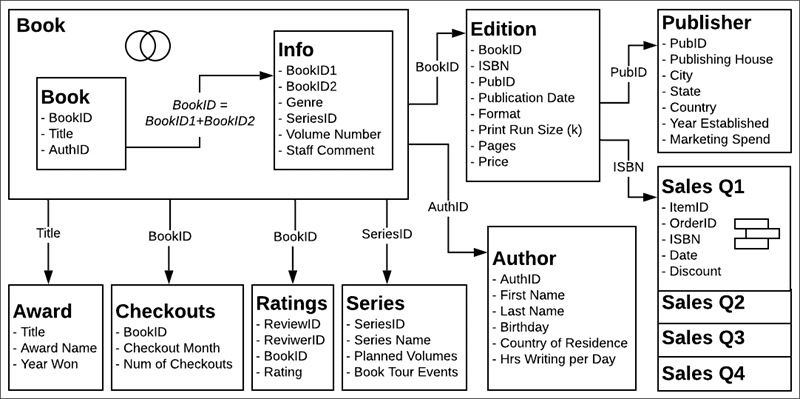
Example: Bookshop Data
We’ll do some analysis with this data source in a moment, so let’s talk about the data.
The dataset is around (fictitious) books, and it’s important to consider the distinction between a book and an edition. A book is the conceptual work itself, with attributes such as the title, author, and genre. There are also editions of a book, with attributes such as a price and format (hardcover or paperback), that are identified with an ISBN. An edition of a book has a publisher and a page count, whereas a book may have won an award or be in a series.
You can follow along by downloading MinimalBookshop.tdsx, or be adventurous and build the model yourself from Bookshop.xlsx. Note that you can hide many of the ID fields once the tables are combined.
Video: Work with multiple tables
Note: The interface for editing relationships shown in this video differs slightly from the current release but has the same functionality.
The Data Source page
Before we go to a sheet tab, notice that the data grid view, below, shows only the fields from one table at a time. If we click to another table, we’ll see the data it contains. There’s no overall view because related data is not brought together until it’s used in an analysis. For now, the data remains in each table and is therefore displayed by table.
If we click on a table with an underlying join or union, we do see that merged data, with any nulls that may involve.
The Data pane
When we click onto a sheet, you may notice that the Data pane looks different than in previous versions of Tableau. Instead of the primary organization of dimensions and measures, it’s now focused on tables. Each table has its own breakdown for dimensions and measures, indicated by this line. It’s possible to still group by folders instead, if you choose.
Number of Records and Count
There’s also no Number of Records field. This is because the concept of Number of Records has changed. There isn’t a single Number of Records for the data source. Each table has a Count field, which can be thought of as a local Number of Records for that table.
To get a sense of the number of records for multiple tables at the same time, you can use Measure Names and Measure Values or multi-select the count fields and use Show Me to create a viz.
Video: Basic calculations
There are a few calculations we can do to make this data set a bit friendlier. First, we can create a calculation for the full author name that brings together first name and last name. We’ll create a calculation called Author Name that is simply first name, a space, and last name. Note that this calculation stays in the Author table because it uses fields only from that table.
[First Name] + " " + [Last Name]
When we make a sale, the sales amount is a combination of the price—fixed by the publisher and specific to the edition, or the ISBN—and any discount at the time of the sale. So the calculation Sales Amount will be price times one minus the discount. Note that we’re using the ZN—or Zero Null—function to handle sales without discounts so we don’t get nulls. This calculation goes to the shared area at the bottom of the Data pane as it uses fields from multiple tables. Aggregated calculations will also go to the bottom of the Data pane.
[Price] * (1-ZN([Discount]))
Video: Sets and groups
We’ll create a set for books to identify if they’re in a series. In the Book table, right click on Title and select Create > Set. We’ll name it In a series. On the Condition tab, choose By field with Series Name, Count, as >= 1.
In the Edition table, the Format field is quite detailed, including specifying mass market and trade paperback. Sometimes that detail is useful, but sometimes we want to generalize between hardcover and paperback. Right click on Format field in the Data pane and select Create > Group. We’ll name it Cover. Control-click to select everything except Hardcover and then click Group. The name of the group is automatically highlighted, and we can call it Paperback.
Like with the Author Name calculation, these items we just created are relevant within a single table and therefore stay within those tables in the Data pane.
Analyze related data
Let’s do a comparison of how analysis looks between relationships and joins. We recommend that you download the companion workbook rather than continue with your own previous data source.
Question: For authors with books in a series, who is has the most book tour events?
Video: Work with different levels of details
Let’s look at which authors we’ll be working with. Using the related data source, we’ll bring Author Name and Series Name to Rows.
Because related data sources pare down unmatched data in tables that only contain dimensions, we’re focusing on the data that is relevant to us. We can see that there are seven authors, two of whom have written for two series. If you don’t want to see only matched values, you can restore those unmatched values (which is more like the legacy behavior) by going to the Analysis menu > Table Layout and checking Show Empty Rows.
| Related | Joined |
|
Using the related data source:
|
Using the joined data source:
Our numbers here look a bit off. |
For the joined data, we know there’s duplication because of the join, and we also know some authors span series. Because of this, we can’t just change the aggregation to, say, MIN or MAX, because we lose information for authors with works in multiple series.
What we really want is the number of events per series, visualized by author. This is a classic case for Level of Detail (LOD) expressions. We’ll create a calculation Series Events:
{FIXED [Series Name] : MIN ([Book Tour Events])}
Note that the MIN is to handle duplication of events for a single series.
Now if we bring this new field to Columns instead of the original events field, we’ll get the correct values.
For the related data, we didn’t need to do any of that. Relationships are smart enough to understand the native level of detail and the way the Author table relates through the Book and Info tables through to the Series table, and to correctly join and aggregate the Events measure back to Author Name—all without having to write LOD calculations.
So don’t be scared of relating your data. See for yourself! You can download the Bookshop data(Link opens in a new window) or use some of your own. Try filtering, using table calculations, building a variety of chart types, configuring performance options, and pushing relationships as far as you can.
Tips when working with related data
- View Underlying Data often to verify what data a mark represents.
- If you aren’t required to join—and there are reasons you may need to—using a relationship provides more flexibility.
- If you don’t want to see only matched values, you can restore those unmatched values by going to the Analysis menu > Table Layout > Show Empty Rows.
Related resources
Ready to tackle calculations with Relationships? Check out Don’t Be Scared of Calculations in Relationships.
Ready to keep exploring how to do complex analysis with Relationships? Check out Don’t Be Scared of Deeper Relationships.
For more information on the technical underpinnings of relationships straight from the Product Management team, check out the series on relationships on the Tableau Blog.
- Relationships, part 1: Introducing new data modeling in Tableau(Link opens in a new window)
- Relationships, part 2: Tips and tricks(Link opens in a new window)
- Relationships, part 3: Asking questions across multiple related tables(Link opens in a new window)
Also see video podcasts on relationships from Action Analytics(Link opens in a new window), such as Why did Tableau Invent Relationships?(Link opens in a new window) Click "Video Podcast" in the Library(Link opens in a new window) to see more.