Stats for Load Times
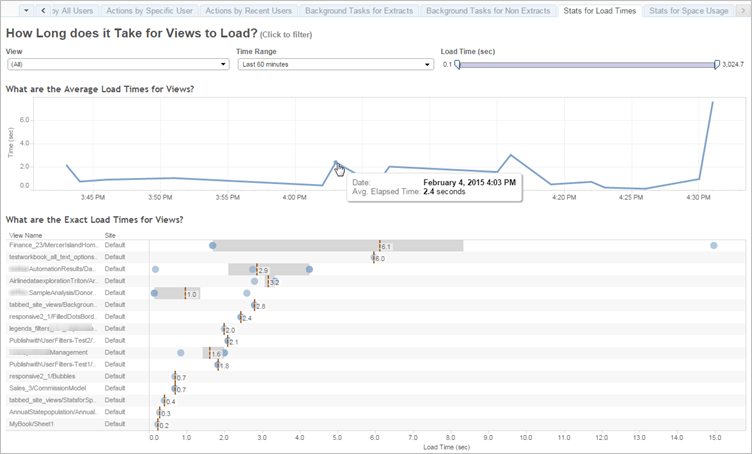
The Stats for Load Times view shows you which views are the
most expensive in terms of server performance. You can filter by view and time range.
The Average Load Times graph shows average load times for views based on the filters you set. Hover over a point to see details. Select a point on the line to update the rest of the view for the selection:

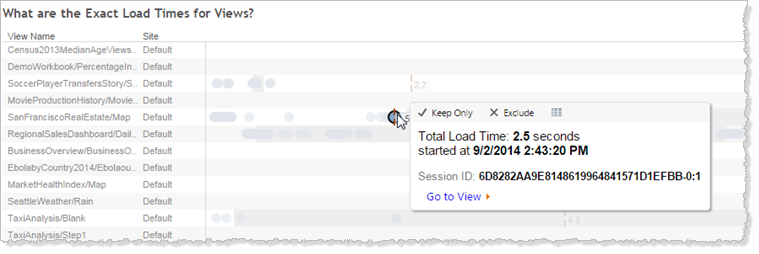
The Exact Load Times view shows exact time to load the listed views. A vertical line shows the average load time for each view. Select a mark to see details of a specific instance of the view loading:

