Sort Data in a Visualization
There are many ways to sort data in Tableau. When viewing a visualization, data can be sorted with single click options from an axis, header, or field label. In the authoring environment, additional sorting options include sorting manually in headers and legends, using the toolbar sort icons, or sorting from the sort menu.
Tip: To explore on your own, download the workbook used in these examples (requires Tableau Desktop).
Quickly sort from an axis, header, or field label
There are multiple ways to sort a visualization with single click sort buttons.
In all cases, one click sorts descending, two clicks sorts ascending, and three clicks clear the sort.
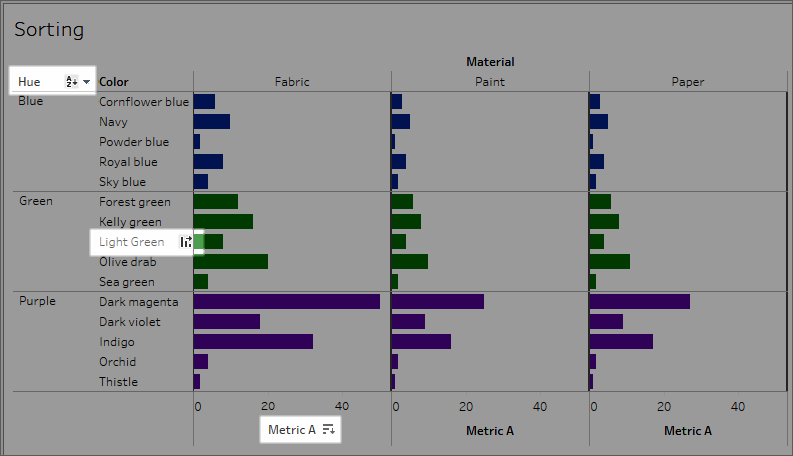
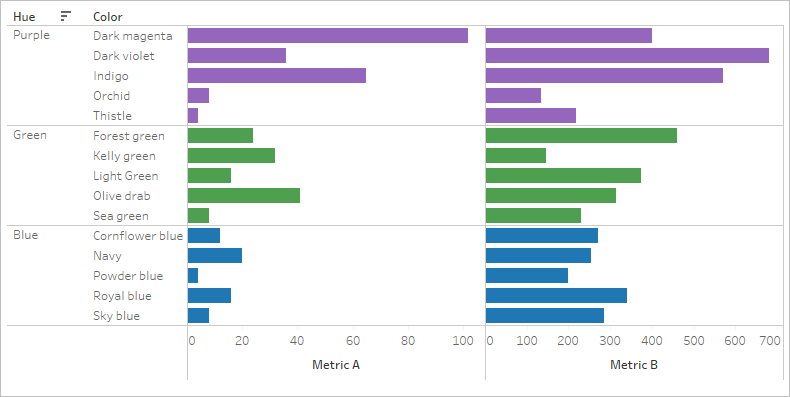
Sort icons shown on a field label (Hue), a header (Light Green), or an axis (Metric A)
The sort updates if the underlying data changes.
Sort from an axis
- Hover over a numerical axis to bring up the sort icon.
- Click the icon to sort.
Sort: Color is sorted within each Hue in decreasing order of Metric A
The sort here is applied to Color (sorting the rows) based on the values for Metric A. If there are hierarchical dimensions like Hue > Color, the sort is applied to the innermost dimension. In this example, Color will sort inside Hue. Dark magenta can't sort to the top of the viz because it must stay inside the pane for the Purple hue.
Sort from a header
- Hover over a header to bring up the sort icon. Alternatively, click a header to bring up its tooltip which includes sort options.
- Click the icon to sort.
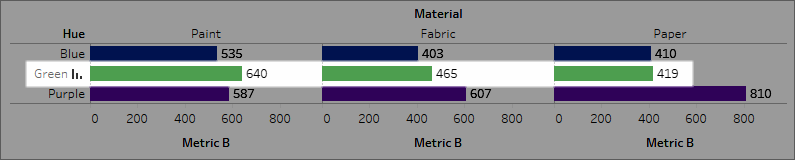
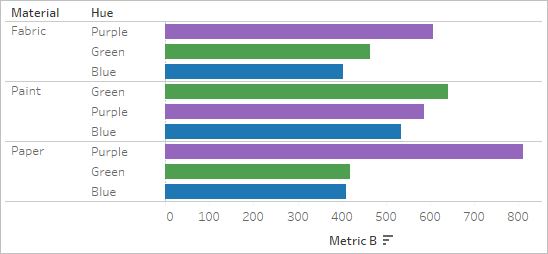
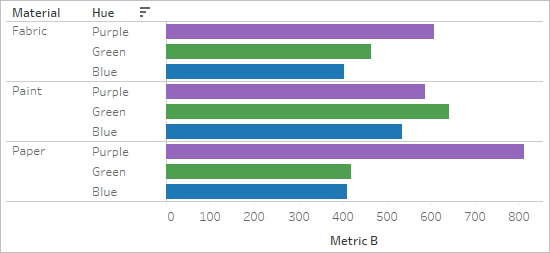
Sort: Materials are arranged in decreasing order of Metric B for Green.
This sort is applied to Material (sorting the order of the columns for Paint, Fabric, and Paper) based on the Metric B values for Green, since that header was used for the sort.
Sort from a field label
- Hover over a field label to bring up the sort icon.
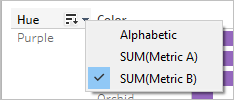
The sort icon for a field label is slightly different from a header or axis. The default option is alphabetical sorting, but there’s also a menu where you can choose to sort by a field in the view.
- Click the A-Z icon
 to sort alphabetically. Or, click the menu to select a field to sort by. The icon switches to the bar icon and you can click to sort.
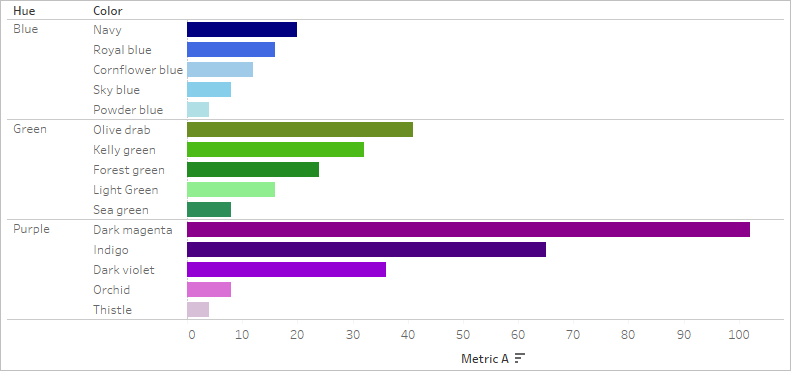
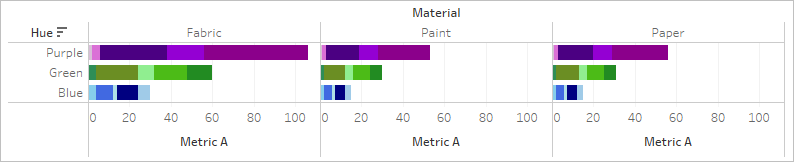
Sort: Hues are arranged in descending order by Metric B.
The sort here is applied to the outermost dimension (Hue) based on total Metric B. (Metric B is aggregated for all the colors within each hue and that combined value is how Hue is sorted. Therefore, Purple is first, then Green, then Blue.)
Missing sort icons
If the sort icons don't appear, this functionality may have been turned off or it might not be possible to sort the view. Sort icons aren't available on the axes in scatterplots or for table calculations. For example, scatterplots can't be sorted from a numerical axis because the positions of the marks are fully determined by the data.
Sort options while authoring
In an authoring environment, additional options are available.
Sort from the toolbar
- Select the dimension you want to sort.
If you don’t select a field before sorting, the default behavior is to sort the deepest dimension.
- Choose the appropriate sort button (ascending or descending) in the toolbar.
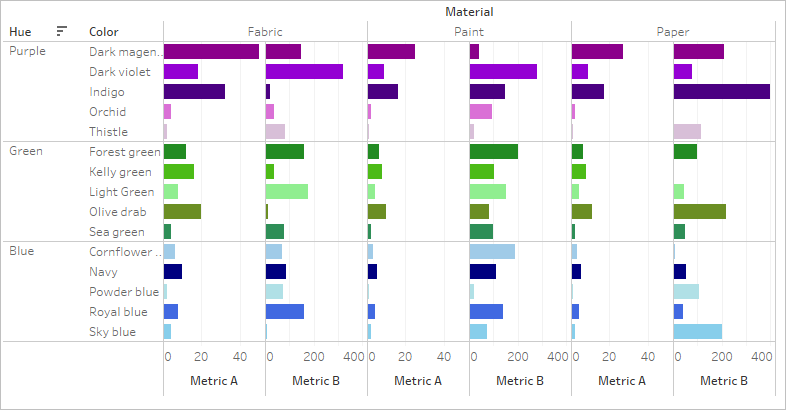
In this example, the sort is applied to Hue unless the Material field is selected before sorting. The toolbar sort also applies to the leftmost measure, in this case Metric B. To sort by Metric A, first reverse the Metric order on the Columns shelf or use another method of sorting. This example demonstrates the effect of sorting by Material. Hue is removed from the view.
Sort by drag and drop
To sort manually, select a header in a viz or on a legend and drag it to the correct location—a heavy black line indicates where to drop the header.
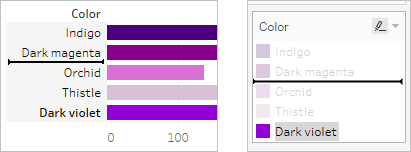
Note: Sorting on a legend also changes the order of the marks, not simply how the legend appears. Whatever is bottommost in the legend becomes the bottommost mark in the viz. This can either mean closest to the axis or header, or actually underneath in scatterplots and other viz types that may have overlapping marks.
Sort specific fields in the viz
Tableau uses the current International Components for Unicode (ICU) library to determine sort order. You can customize sorting by using the Sort menu for specific fields. (The Sort menu isn’t available for continuous measures.)
- Right-click (Windows) or control-click (Mac) the field you want to sort, and select Sort.
- Select a Sort By option, and configure its behavior:
-
Data Source Order sorts based on how the data is sorted in the data source. Generally for relational data sources, this tends to be natural sort order. Natural sort order is an alphabetic sort where multi-digit numbers are treated as a single character. For example, natural sorting puts 2 before 19 because 2 is less than 19, whereas alphabetic sorting puts 19 before 2 because 1 is less than 2.
If you’re using a multidimensional cube data source, data source order is the defined in hierarchical order of the members within a dimension.
-
Alphabetic sorts the data alphabetically. This sort is case sensitive, sorts [A-Z] before [a-z], and treats digits individually (that is, 19 comes before 2).
To create a non-case sensitive sort, create a calculated field by using the UPPER() or LOWER() functions to remove variation in capitalization. For more information, see String Functions(Link opens in a new window).
-
Field lets you specify the field value used to determine the sort order. The field doesn’t need to be used in the visualization. You can also select an aggregation for the sorting field. The aggregation options available depend on the field type.
-
Manual lets you select a value and move it to the desired position, either by dragging it in the list or using the arrows to the right.
-
Nested lets you select the field value used to determine the sort order. The field doesn’t need to be used in the visualization. You can also select an aggregation for the sorting field. The aggregation options available depend on the field type.
Nested sorts
When the values to be sorted occur in multiple panes, there are two ways to sort: nested and non-nested (or comparative). In the following image, all three values for Hue occur for all three Materials. Nested sorting considers values independently per pane rather than in aggregate across panes.
| Nested | Non-nested |
|
|
|
A nested sort considers each pane independently and sorts the rows per pane. Purple is sorted above Green for Fabric and Paper, but below Green for Paint. |
A non-nested sort considers the value across panes and has the same order of values per pane. Purple is above Green for all materials because in aggregate, Purple is higher than Green. |
| Nested sorts look correct within the context of the pane, but don’t convey the aggregated information about how the values compare overall. | Non-nested sorts may look incorrect in a single pane, but consistently convey how the aggregated values compare overall. |
| Sorting from an axis gives a nested sort by default. | Sorting from a field label gives a non-nested sort by default. |
Note: When creating a nested sort, the sort is inherited when you drill down through the dimensions. For example, a nested sort on Hue will apply to Color.
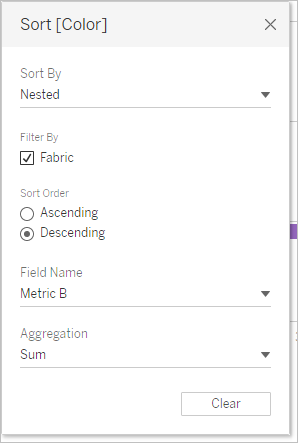
If a dimension has been placed on the same shelf as a measure, that measure has an axis in the view for each value of the dimension. Using the axis sort icon generates a nested sort specifically for that value.
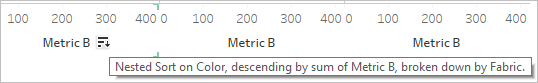
In this scenario, an additional field is added to the sort menu dialog for the sorted dimension. To stop breaking down the sort by this value, deselect the box for Filter By.
Understanding “incorrect” sorts
It’s easy to think a view is sorted incorrectly when in fact the sort logic isn’t clear. A view with a nested sort when a non-nested sort is expected (or vice versa) can be perceived as incorrect. Sorting when there are multiple panes can also give results that seem unsorted.
For example, this view might seem unsorted when in fact it’s sorted on Hue by Metric A.
Simplifying the view makes the sort more obvious.
Hovering over the sort icons to see the description of the sort or temporarily simplifying the view can help clarify what is going on.
Clear sorts
You can sort data from many areas of a view. Sometimes it can be useful to clear all sorts at once.
To remove the sort on a specific field, right click to open the menu and select Clear Sort.
To remove all sorts in the view, open the menu next to the clear sheet icon in the toolbar and select Clear Sorts. Or, from the Worksheet menu, click Clear > Sorts.
Remove the ability to sort
As an author, you can turn off the sort icons in published content. This can be useful to preserve the current sort as you built it. Go to the Worksheet menu and deselect the option to Show Sort Controls. The sort icons won't appear when a consumer of the view hovers over an axis, header, or field label.
Hiding field labels, headers, or the axis will also remove the sort icons.