Create Geographic Layers for Maps
When you need to add multiple layers of geographic data to a map, use marks layers in the Marks card. Marks layers act like transparent overlays. Each layer functions independently and can have its own mark type, captions, and color.
Note:
- Marks layers can be used only with geographic data.
- Fields can be shared between marks layers, but any filters that you apply to a field will apply to all marks layers
Build a view using marks layers
As you build a map, options for creating marks layers become available when you add more geographic fields to the view.
Add a marks layer
-
Build your first map in the view. Think of this as the base layer.
-
Drag a geographic field into the view. Notice the Add a Marks Layer control becomes available in the top left corner of the view.
-
Drop the geographic field on the Add a Marks Layer control. A new marks layer is added to the Marks card and the layer is displayed in the view.
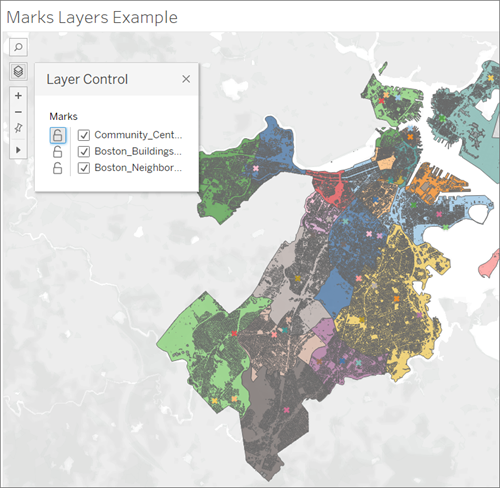
Example: Working with mark layers
The following walk through uses the sample workbook Marks Layers Example.
-
Open the Marks Layers Example workbook. It uses a connection to a geographic data source.
-
Drag the Neighborhood Geometry field to the view. This creates a map in the view.
-
Drag the Neighborhood Names field to Color on Marks card.
-
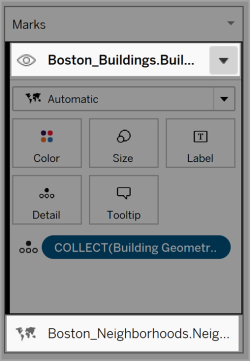
Drag the Building Geometry field to the view. The Add a Marks Layer drop target displays in the top left corner of the view.
Notice that the Marks card now includes two layers labeled Boston_Buildings.Building Geometry and Boston_Neighborhoods.Neighborhood Geometry.
-
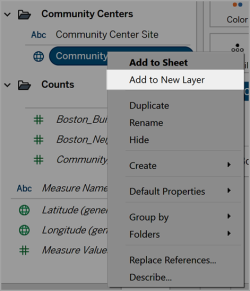
Add another layer of data to the view. Drag Community Centers Geometry to the view. Note: As a shortcut, you can right click a geographic field and click Add to New Layer in the drop-down menu.
-
In the sample workbook, click the new layer to open its Marks options, and then drag the Community Centers Name field to Color.
-
To change the mark type, click the mark type drop-down arrow, and then select Shape. Click Shape field on the Marks card for this layer, and then select the heavy 'X'.
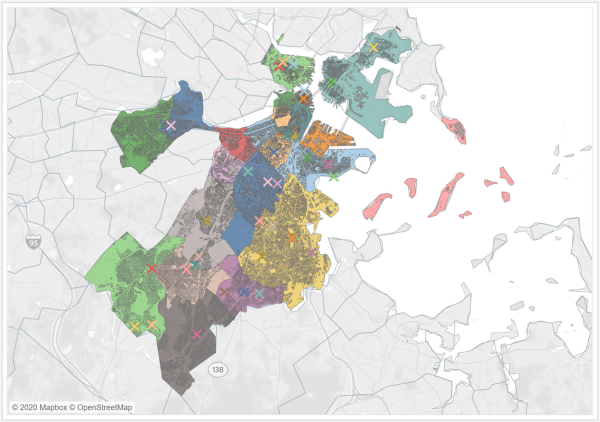
Each layer’s mark type, color, and formatting can be configured independently. To change the look of any layer, click that layer to expand its Marks card, and then drag a geographic field to one of the Marks card properties such as Color.
Control mark selection in layers
After you add layers to the view, you may want to control how the user interacts with the layers. With one layer, it is easy to select a single mark to get extra information, such as a caption or text label. However, with multiple layers, it might not be the best user experience to allow your audience to select all marks on all layers. You can control how your users interact with layers in the marks layers settings.
There are two ways to control how a user selects layers in the view.
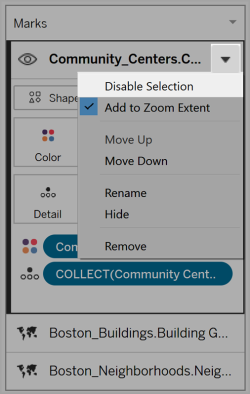
Disable mark selection
In the Marks card, click the drop-down arrow for a layer, and then select Disable Selection. This prevents users from selecting marks from that layer in the view.
Hide a layer
To hide all marks on a layer
-
In the Marks card, click the Control Layer Visibility icon to the left of the layer name.
The icon becomes visible when you select the layer in the Marks card, and stays visible when layer visibility is disabled.
-
To show a layer, click the icon again.

Change layer settings
After you create a map with multiple layers, you can change layer order, rename layers, remove layers, or hide layers.
Change layer order
Tableau renders the layers based on their order in the Marks card. Marks in layers at the top of the list will be displayed over marks in layers at that are lower in the list. To change the layer order
1. In the Marks card, click a layer name and drag it until the orange indicator arrow appears. Orange indicates where the layer can be moved to.
2. Drop the layer in the new order location. Note: To cancel the move while you are dragging the layer, drop the layer in a different part of the view (wherever the orange indicator arrow isn’t displayed).
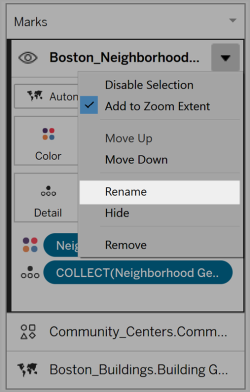
Rename layers
When a new layer is created, Tableau assigns a name automatically based on the table name and field name. With large data sources, it can become difficult to manage many different layers. You can make this easier by renaming the layers and giving each layer a distinct name. To rename a layer
1. In the Marks card, click a layer, and then click the drop-down arrow to the right of the layer name.
2. Select Rename, type the new name, and then press Enter.
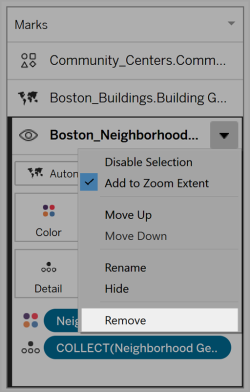
Remove layers
If a layer is not useful anymore, you can remove it.
To remove a layer:
-
In the Marks card, click a layer.
-
Click the drop-down arrow to the right of the layer name, and then select Remove.
Add to Zoom Extent
By default, when you add a new layer to a map, Tableau will include all marks in the view. If there is a large difference between the scale of marks—for example, one layer showing all streetlights in a neighborhood and the other layers showing the whole country’s electrical grid—the desired detail can be lost.
To resolve this, we can disable this feature on a per-layer basis by selecting the drop-down arrow on the layer name then deselect Add to Zoom Extent.
Let users customize views with the Layer Control
With the advent of Geographic Layers for Maps, you have the ability to create dense and information rich views. However, these views may become difficult to navigate as the number of layers and marks increases.
The Layer Control is a panel that expands in the view when selected, displaying all the geographic data layers, and giving you quick access to each marks layer.
By using the Layer Control, you can hide or disable interactions on each layer, as well as save that selection as a custom view if you are working with a published workbook.
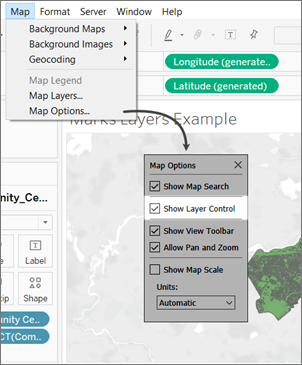
Enable the Layer Control
As the author, you can enable the Layer Control prior to publishing the workbook.
- Select Maps > Map Options > Check or Uncheck “Layer Control”
By default, Layer Control is checked, so when a workbook is published, users will be able to access the panel and hide or show mark layers.
Using the Layer Control
If the Layer Control is enabled, the Layer Control icon will appear in the Map Controls on the upper left hand side of the view. Clicking on the icon will expand a panel where we can see all of the mark layers in the view.
The Layer Control can be dragged around the view freely, but the position will reset each time the view is reloaded.
Each layer in the panel has a pair of icons next to it: the Interaction icon and the Visibility toggle. Any changes you make using the Control will be reflected in the Marks Layers. Hiding a layer using the Control functions exactly the same as hiding a layer in the Marks Layers card.
Selecting the Interaction icon will turn off the ability to select or interact with marks on that layer. This can be very useful for keeping background elements from being selected when doing a lasso selection, for example.

Toggling Visibility off will hide all the marks on a layer, while toggling it on will show all the marks in the layer. Note that marks that are hidden are also removed from any selections.
Custom views with the Layer Control
When you publish a view with the Layer Control enabled, any changes a user makes to the layers with the Layer Control won’t be retained.