JSON File
This article describes how to connect Tableau to a local JSON file and set up the data source.
Make the connection and set up the data source
-
Start Tableau and under Connect, select JSON File. Then do the following:
-
Select the file you want to connect to, and then select Open.
-
In the Select Schema Levels dialog box, select the schema levels you want to view and analyze in Tableau, and then select OK. For more information, see Select schema levels.
-
-
On the data source page, do the following:
-
(Optional) Select the default data source name at the top of the page, and then enter a unique data source name for use in Tableau. For example, use a data source naming convention that helps other users of the data source figure out which data source to connect to.
-
Select the sheet tab to start your analysis.
-
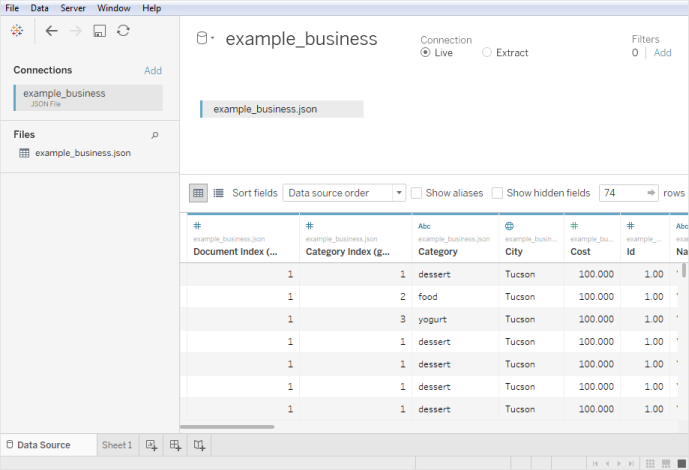
JSON file data source example
Here is an example of a JSON file as a data source using Tableau Desktop on a Windows computer:
Select schema levels
When you connect Tableau to a JSON file, Tableau scans the data in the first 10,000 rows of the JSON file and infers the schema from that process. Tableau flattens the data using this inferred schema. The JSON file schema levels are listed in the Select Schema Levels dialog box. In Tableau Desktop, if your JSON file has more than 10,000 rows, you can use the "Scan Entire Document" option to create a schema.
Note: The "Scan Entire Document" option displays only for JSON files with more than 10,000 rows. It is not available on the web.
The schema levels that you select in the dialog box determine which dimensions and measures are available for you to view and analyze in Tableau. They also determine which data is published.
Note: When you publish a workbook to the web, any schema updates will not be available to the web version of the viz and may cause errors if the viz is subsequently refreshed
If you select a child schema level, the parent level is also selected.
| For example, here's a snippet of a JSON file: | The JSON file generates these schema levels: |

|

|
Detect new fields
Sometimes, more fields exist in rows that were not scanned to create the inferred schema. If you notice that a field you need is missing under Schema, you can choose to do one of the following:
-
Scan the entire JSON document. It may take a long time for the scan to complete.
-
Select schema levels from the schema listed and then select OK. Tableau reads your entire document and if more fields are found, they are listed in the Select Schema Levels dialog box.
Whenever Tableau detects that new fields are available, for example, during an extract refresh or when Tableau creates an extract after you’ve selected the schema levels, either an information icon near the file name or a notification on the Select Schema Levels dialog box will indicate that additional fields have been found.
Change schema levels
You can change the schema levels you selected by going to the data source page and selecting Data > [JSON file name] > Select Schema Level. Or, hover over the file name on the canvas and select the drop-down menu > Select Schema Level.
Union JSON files
You can union JSON data. To union a JSON file, it must have a .json, .txt, or .log extension. For more information about union, see Union Your Data.
When you union JSON files, the schema is inferred from the first 10,000 rows of every file in the union.
You can change the schema levels after you union files. For more information, see Change schema levels.
How dimension folders are organized for hierarchical JSON files
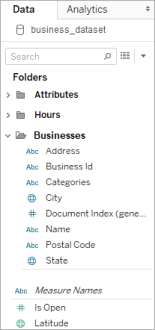
After you select the sheet tab, the selected schema levels of your JSON file show under Dimensions on the Data pane. Each folder corresponds with the schema level you selected, and the attributes associated with that schema level are listed as children of the folder.
For example, in the following image, Address is a dimension under the schema level Businesses folder. Categories is also a schema level, but because it is a list of values and not a hierarchy of data, it doesn't require its own folder, but is instead grouped under a parent folder. Note that schema levels in the Select Schema Levels dialog box do not map directly to the folder structure in the Data pane. Folders in the Data pane are grouped by object so that you can easily navigate to fields and still have context for where the fields come from.
For each document, a unique index is generated and stored in the flattened representation of data. An index is also generated for each level in the schema.
For example, in the image above, in addition to the Document Index (generated) entry, the Attribute and Hours schema levels all have generated indexes.
Why measures are calculated in hierarchical JSON files
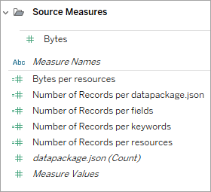
When a hierarchical JSON file is flattened, data might be duplicated. To keep measures consistent with their schema levels, Tableau creates level of detail (LOD) calculations to accurately represent the data at the schema level. The original measures are located in the Source Measures folder and you can use them, but we recommend that you use the calculated measures.
On the Data pane, calculated measures are labeled as Number of <measure name> per <parent name>.
To view the LOD calculation for a measure, follow these steps:
-
Select the measure.
-
Select the drop-down arrow, and then select Edit.
The following example shows the LOD calculation for Revenue per Document. The formula selects the maximum revenue for each document index value.
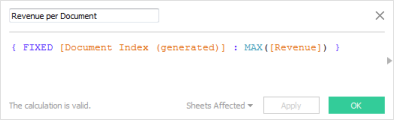
The use of LOD calculations means that you can select multiple schema levels and be confident that the measures are not over-counted.
Tips for working with JSON data
These tips can help you work with your JSON data in Tableau.
-
Do not exceed the 10x10 limit for nested arrays.
A high number of nested arrays creates a lot of rows. For example, 10x10 nested arrays result in 10 billion rows. When the number of rows Tableau can load into memory is exceeded, an error displays. In this case, use the Select Schema Levels dialog box to reduce the number of selected schema levels.
-
A data source that contains more than 100 levels of JSON objects can take a long time to load.
A high number of levels creates a lot of columns, which can take a long time to process. As an example, 100 levels can take more than two minutes to load the data. As a best practice, reduce the number of schema levels to just the levels that you need for your analysis.
-
A single JSON object cannot exceed 128 MB.
When a single object top-level array exceeds 128 MB, you must convert it to a file where the JSON objects are defined one per line.
-
The pivot option is not supported.
About .ttde and .hhyper files
You might notice .ttde or .hhyper files when navigating your computer's directory. When you create a Tableau data source that connects to your data, Tableau creates a .ttde or .hhyper file. This file, also known as a shadow extract, is used to help improve the speed your data source loads in Tableau Desktop. Although a shadow extract contains underlying data and other information similar to the standard Tableau extract, a shadow extract is saved in a different format and can't be used to recover your data.
Note: .tde files are no longer supported for Tableau versions beyond 2024.2. All extracts are now in .hyper format.
See also
- Set Up Data Sources – Add more data to this data source or prepare your data before you analyze it.
- Build Charts and Analyze Data – Begin your data analysis.