Data Source Page
During your analysis in Tableau, you have the flexibility to modify the data source. This can be done on the data source page, which Tableau directs you to after you establish the initial connection to your data. Additionally, you can access the data source page by selecting the Data Source tab from any location within the workbook.
The data source page generally consists of four main areas: left pane, canvas, data grid, and metadata or semantics grid.
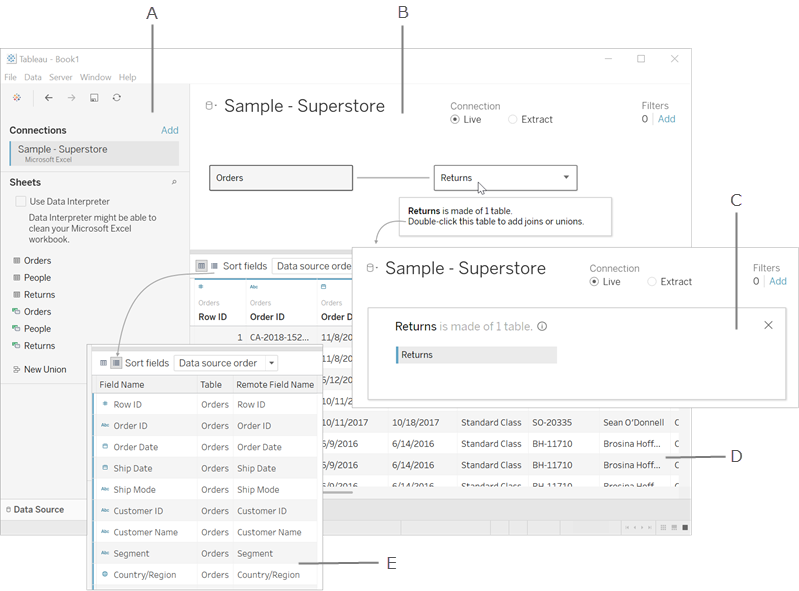
Left pane
The left pane of the data source page shows details about your data. The data that Tableau Desktop is connected to. You can also use the left pane to add more connections to the data source to create cross-database joins.
-
For file-based data, the left pane shows the file name and the worksheets in the file.
-
For relational-based data, the left pane shows the server, the database, or schema, and the tables in the database.
-
For cube (multidimensional) data, the left pane doesn't appear.
Canvas
When connecting to relational and file-based data sources in Tableau, you can drag tables onto the canvas area to begin setting up your data source. The canvas is divided into two conceptual layers: a logical layer and a physical layer. By default, the logical layer is shown, showcasing the relationships between logical tables. To switch to the physical layer, double-click on a logical table to start creating joins and unions between tables in the physical layer.
Logical tables can have descriptions that appear in their tooltips. These tooltips only appear in the Data Source tab.
To add a description, select a table in the canvas and click the edit icon (pencil) next to the description in the bottom pane.
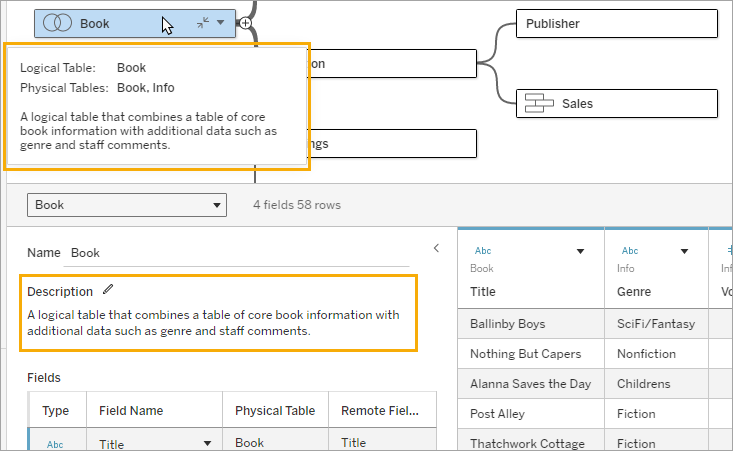
For web authoring, any links in a description are live and can be clicked to open directly.
Cubes
When working with cube data sources, the top section of the data source page will show the available catalogs, queries, and cubes that you can use. This allows you to connect to and analyze data from cube sources within Tableau.
Refreshing your data source
You can update your data when it changes, depending on what type of data you're connected to. For instance, if you're connected to a data extract, you can refresh it with the Refresh button next to the Connection area on the left side of the pane.
For more information about refresh options see Refresh Data Sources(Link opens in a new window).
For more information about refreshing data extracts, see Refresh Extracts(Link opens in a new window).
Data grid
To analyze the fields and the first rows of data within the Tableau data source, use the data grid. The data grid allows for semantic modifications of the Tableau data source, such as sorting or hiding fields, renaming fields, creating calculations, and adding aliases. When working in the logical layer, you can view the data specific to the selected table.
The physical layer shows merged data resulting from joins and unions. For Web Data Connector, file- and relational-based data sources in Extract mode, the grid provides access to extract data, including extract only calculations.
-
In the logical layer, you see the data for the selected table.
-
In the physical layer, you see the merged data based on the joins and unions.
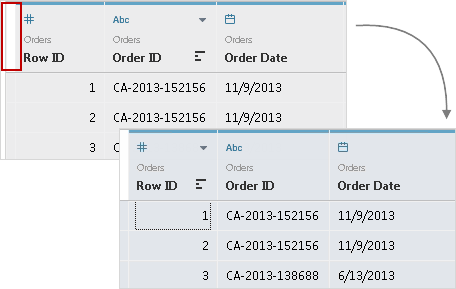
Select fields
To select multiple fields in the grid, select a column, and then drag the mouse to select more columns.
To select all fields, click the area in the upper-left corner of the grid like in this example.
Note: The grid doesn't appears for cube (multidimensional) data.
Metadata grid
The metadata grid shows the fields in your data source as rows, allowing you to analyze the semantics and carry out tasks like renaming fields or hiding multiple fields. When connected to cube or some extract only data, the metadata grid shows by default.